
 Facebook
 X
X
 Pinterest
 Copy Link
Bucks County, PA
Year-over-year, Bucks County’s inventory increased significantly by 33.5%, reaching 1,028 active listings compared to 770 in September 2023. The number of homes sold rose 15.1%, totaling 527 units compared to 458 last year. Pending contracts saw a slight year-over-year increase of 1.9%, reaching 439 compared to 431 in 2023. The median sold price increased 9.4% year-over-year, reaching $480,000 from $438,800. Average days on market (DOM) fell by one day to 26, while the list-to-sold price ratio decreased to 96.0% from 96.7%.
Montgomery County, PA
Inventory in Montgomery County grew 23.3% year-over-year, with 1,382 active listings compared to 1,121 in September 2023. Despite this increase, sold units declined slightly by 2.1%, with 701 sales versus 716 the previous year. Pending contracts increased by 11.2% year-over-year, totaling 607. The median sold price rose by 2.4% year-over-year to $435,000 from $425,000. The average DOM increased by three days to 31, while the list-to-sold price ratio dropped from 98.5% to 94.8%.
Chester County, PA
Chester County’s inventory expanded by 11.7% year-over-year, reaching 933 active listings compared to 835 in September 2023. Home sales increased 2.2% year-over-year, with 458 units sold versus 448 in the previous year. Pending contracts rose by 10.4% year-over-year to 415. The median sold price saw a year-over-year growth of 9.6%, reaching $530,000 from $483,500. The average DOM remained unchanged at 24 days, while the list-to-sold price ratio decreased from 98.1% to 97.2%.
Berks County, PA
Year-over-year, Berks County’s inventory grew by 7.4%, reaching 422 listings, up from 393. Sold units experienced a slight decline of 0.6%, totaling 356 compared to 358 last year. Pending contracts increased by 12.3% year-over-year, totaling 374. The median sold price grew 6.8% year-over-year to $283,000 from $264,900. The average DOM increased by two days to 24, while the list-to-sold price ratio remained relatively stable, rising slightly from 98.1% to 98.2%.
Northeast Philadelphia, PA (NEPHL)
Inventory in NEPHL saw a 3.4% year-over-year increase, reaching 487 active listings from 471 in the prior year. The number of sold units dropped by 6.8% year-over-year, totaling 234, down from 251. Pending contracts fell 10.1% year-over-year to 187. The median sold price grew 7.7% year-over-year to $296,300 from $275,000. The average DOM decreased by four days to 31, while the list-to-sold price ratio slightly dropped from 97.1% to 96.6%.
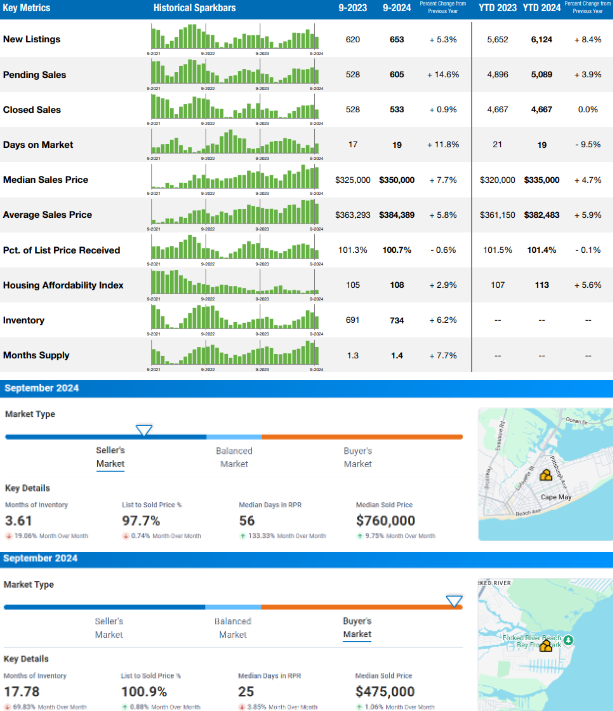
Greater Lehigh Valley Region (GLVR), PA
GLVR’s inventory grew 6.2% year-over-year, reaching 734 listings from 691 in September 2023. Home sales rose by 0.9% year-over-year to 533, up from 528. Pending contracts experienced a strong 14.6% increase year-over-year, reaching 605. The median sold price climbed 7.7% year-over-year to $350,000 from $325,000. The average DOM increased by two days to 19, while the list-to-sold price ratio dipped slightly from 101.3% to 100.7%.
Mercer County, NJ
Year-over-year, inventory in Mercer County grew significantly by 31.5%, reaching 722 listings compared to 549 in September 2023. The number of homes sold saw a modest 2% increase year-over-year to 249 from 244. Pending contracts slightly declined by 0.4% year-over-year to 232. The median sold price rose 9.2% year-over-year to $420,000 from $384,500. The average DOM decreased by three days to 30, and the list-to-sold price ratio improved to 100% from 96.7%.
Cape May, NJ
Month-over-month, Cape May saw a 9.75% increase in the median sold price, reaching $760,000. Home sales dropped by 3.3% month-over-month, with 29 properties sold compared to the prior month. Active listings decreased by 16.3% month-over-month to 87. The average DOM increased dramatically month-over-month by 133.33% to 56 days, while the list-to-sold price ratio fell slightly to 97.7%, down 0.74%.
Ocean County, NJ
Ocean County’s median sold price increased 1.06% month-over-month to $475,000. Home sales dropped by 8.1% month-over-month, totaling 815 units. Active listings saw a significant decline of 69.4% month-over-month, reaching 14,526. The average DOM dropped slightly month-over-month by 3.85% to 25 days, while the list-to-sold price ratio rose to 100.9%, up 0.88%.
Atlantic County, NJ
In Atlantic County, the median sold price increased by 2.2% month-over-month, reaching $370,000. The number of homes sold dropped by 5.7% month-over-month to 279. Active listings decreased by 2.6% month-over-month to 1,060. The average DOM fell 15.38% month-over-month to 22 days, while the list-to-sold price ratio dropped 1.14% to 98%.
This overview highlights the varying market trends across regions, showing both year-over-year and month-over-month changes. While some markets displayed growth in inventory and median prices, others saw declines in sales or adjustments in pricing power.
Check out our previous Market Updates!


")
