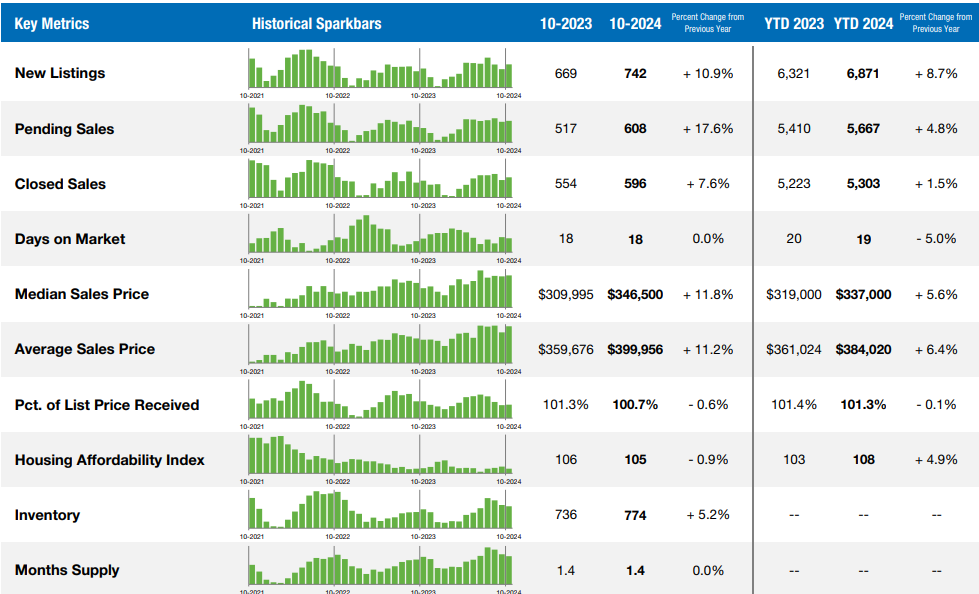
The October 2024 real estate market revealed significant shifts across key regions, showcasing both growth and stabilization in various metrics. Here’s a breakdown of market performance by location, including insights from Bucks, Berks, Montgomery, Chester, Northeast Philadelphia, Mercer, and Greater Lehigh Valley (GLVR).
Greater Lehigh Valley (GLVR)
The GLVR market demonstrated consistent year-over-year improvement. The median sold price increased by 11.8%, reaching $346,500, while homes sold rose 7.6% to 596. Active listings grew by 5.2% to 774, reflecting a healthier inventory picture compared to October 2023. The average days on market (DOM) remained steady at 18, indicating sustained buyer demand. The list-to-sold price ratio, however, dipped slightly to 100.7% (down 0.6%).
Cape May, NJ
Cape May experienced a strong month-over-month performance. The median sold price surged 23% to $935,000, and homes sold increased 10.3% to 32 transactions. Active listings declined by 6.7% to 83, suggesting tightening inventory. The average DOM dropped significantly by 55.36% to 25 days, highlighting heightened buyer urgency. The list-to-sold price ratio also improved by 1.29%, reaching 99%.
Ocean County, NJ
Ocean County showed cooling trends month-over-month. The median sold price fell 3.2% to $450,000, and homes sold decreased by 8.2%, with 765 transactions. Active listings plummeted 88.5% to 8,298, reflecting a constrained market. The average DOM rose by 4% to 26 days, and the list-to-sold price ratio declined slightly to 99.8% (down 1.14%).
Atlantic County, NJ
Atlantic County displayed mixed month-over-month results. The median sold price rose 8.42% to $400,000, but homes sold decreased by 12.5%, with 273 transactions. Active listings fell by 3.4% to 1,087 properties, while the average DOM edged up by 4.35% to 24 days. The list-to-sold price ratio increased modestly to 98% (up 0.78%).
Bucks County, PA
Bucks County experienced significant year-over-year growth in inventory and sales. Active listings rose 23.4% to 996, while homes sold increased 3.8% to 520 units. The median sold price climbed 5.1% to $470,000, up from $447,000 in October 2023. Pending contracts also surged 20.9% to 462, indicating strong future activity. The average DOM decreased slightly to 26 days, down from 27, but the list-to-sold price ratio dipped to 96%.
Montgomery County, PA
Montgomery County saw substantial growth. Active listings rose 25.7% to 1,435, and homes sold increased 9.9% to 751 units. The median sold price grew 4.8% year-over-year, reaching $440,000, while pending contracts rose 10.9% to 652. The average DOM increased slightly to 31 days, up from 28, and the list-to-sold price ratio dropped to 95.8%.
Chester County, PA
Chester County displayed a positive trend. Active listings increased by 10.3% to 923, and homes sold rose 13.2% to 490 units. The median sold price climbed 6.1% to $525,000, and pending contracts grew 6.9% to 415. The average DOM ticked up to 25 days, from 24, while the list-to-sold price ratio remained stable at 97.9%.
Berks County, PA
Berks County showed modest growth year-over-year. Active listings dipped slightly by 0.7% to 423, but homes sold increased by 9.8% to 381 units. The median sold price grew 7.7% to $280,000, up from $260,000. Pending contracts rose 20.5% to 376, while the average DOM increased slightly to 23 days, from 22. The list-to-sold price ratio improved to 99%.
Mercer County, NJ
Mercer County showed robust growth. Active listings rose 19.5% to 681, while homes sold increased 14.2% to 321. The median sold price surged 9.2% to $453,000, compared to $415,000 in October 2023. Pending contracts grew by 7.2% to 238. The average DOM decreased to 30 days, down from 32, and the list-to-sold price ratio rose to 98.5%.
Northeast Philadelphia (NEPHL)
Northeast Philadelphia experienced modest gains. Active listings rose 7.5% to 533, while homes sold decreased 5.3% to 251 units. The median sold price increased by 5.6% to $285,000, and pending contracts grew 4.9% to 214. The average DOM fell to 31 days, down from 34, while the list-to-sold price ratio declined to 96.6%.
Market Summary
Across all tracked regions, inventory levels generally improved year-over-year, with several areas showing strong growth in sold units and median pricing. However, some markets displayed signs of stabilization, with modest increases in DOM and list-to-sold price ratios indicating evolving buyer and seller dynamics.
For more insights or personalized real estate guidance, visit our blog or contact us today!

 Facebook
 X
X
 Pinterest
 Copy Link


