
 Facebook
 X
X
 Pinterest
 Copy Link
Real Estate Market Trends in Various Counties
As we navigate through the real estate market data for different counties, some interesting trends emerge. Here’s a closer look at the latest statistics:
Berks County, PA
- Median Sold Price: $282,450 (down 0.63% month-over-month)
- Homes Sold: 338 (down 14.4% month-over-month)
- Active Listings: 372 (up 12.4% month-over-month)
- Median Days in RPR: 6 days
- List to Sold Price Ratio: 101.6% (up 0.4% month-over-month)
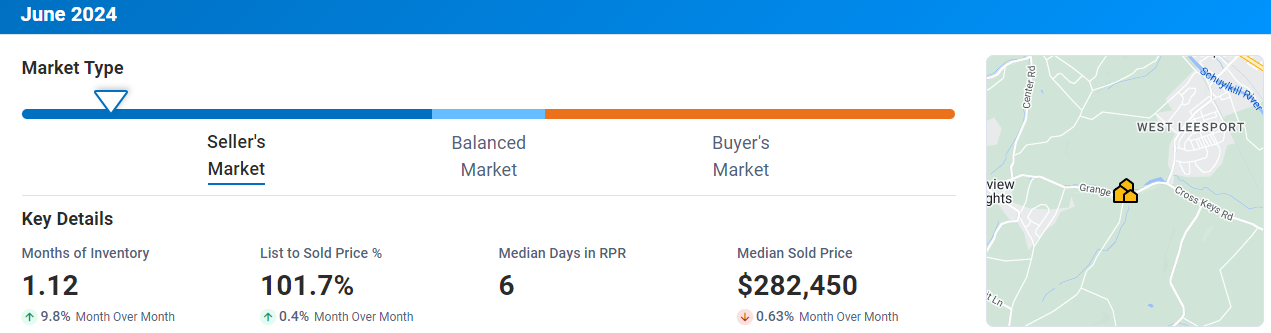
The real estate market in Berks County shows a slight decrease in median sold prices and the number of homes sold. However, there’s an increase in active listings and the list-to-sold price ratio.
Bucks County, PA
- Median Sold Price: $525,000 (up 5.37% month-over-month)
- Homes Sold: 500 (down 4.6% month-over-month)
- Active Listings: 712 (down 3.3% month-over-month)
- Median Days in RPR: 9 days
- List to Sold Price Ratio: 101.8% (up 0.02% month-over-month)
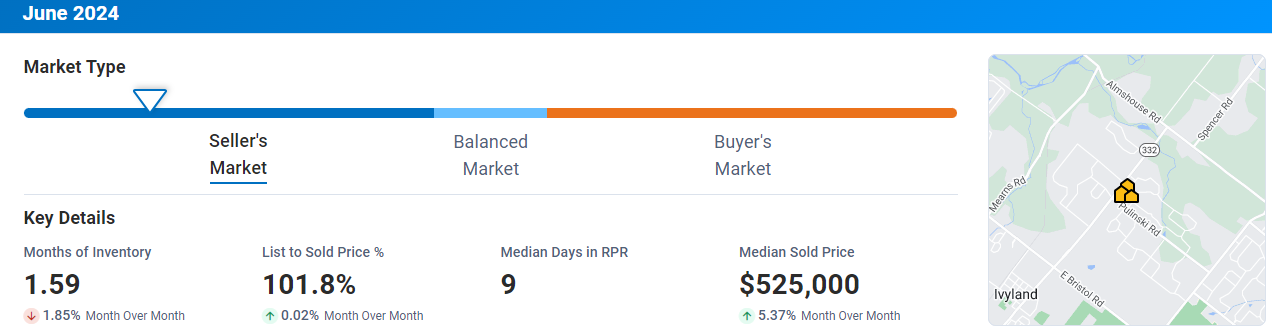
Bucks County experienced a notable increase in median sold prices, despite a slight decrease in homes sold and active listings. The list-to-sold price ratio also saw an uptick.
Chester County, PA
- Median Sold Price: $575,000 (up 4.55% month-over-month)
- Homes Sold: 580 (up 19.3% month-over-month)
- Active Listings: 641 (up 5.1% month-over-month)
- Median Days in RPR: 6 days (up 20% month-over-month)
- List to Sold Price Ratio: 103.7% (down 0.13% month-over-month)
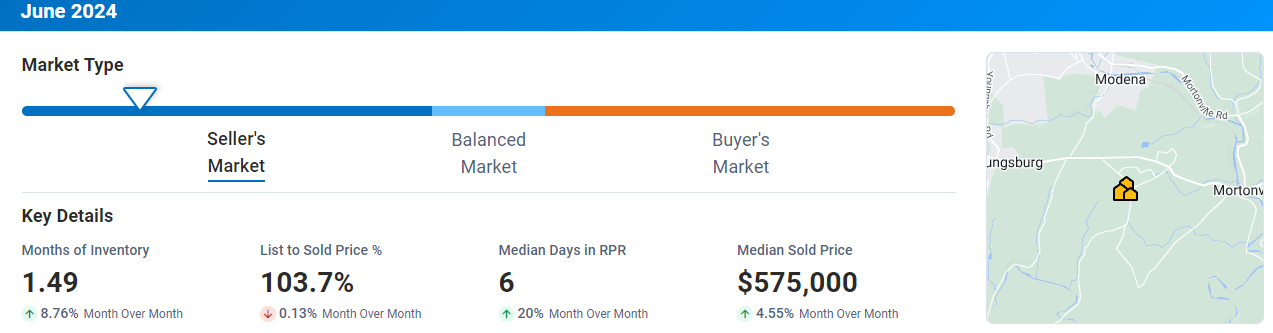
Chester County shows a strong performance with increases in median sold prices, homes sold, and active listings. However, the list-to-sold price ratio slightly declined.
Lehigh Valley, PA
- Median Sold Price: $361,100 (up 10.83% month-over-month)
- Homes Sold: 345 (up 1.8% month-over-month)
- Active Listings: 411 (up 6.5% month-over-month)
- Median Days in RPR: 8 days (up 14.29% month-over-month)
- List to Sold Price Ratio: 102.4% (up 0.31% month-over-month)
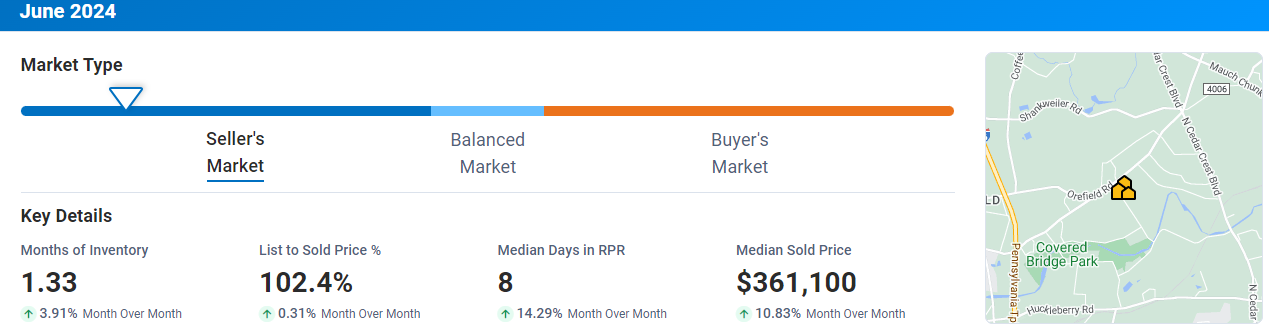
Lehigh Valley demonstrates significant growth in median sold prices and a steady increase in homes sold and active listings. The list-to-sold price ratio also rose notably.
Mercer County, PA
- Median Sold Price: $212,500 (down 5.56% month-over-month)
- Homes Sold: 11 (up 37.5% month-over-month)
- Active Listings: 25 (up 13.6% month-over-month)
- Median Days in RPR: 65 days (up 51.16% month-over-month)
- List to Sold Price Ratio: 93.6% (down 2.99% month-over-month)
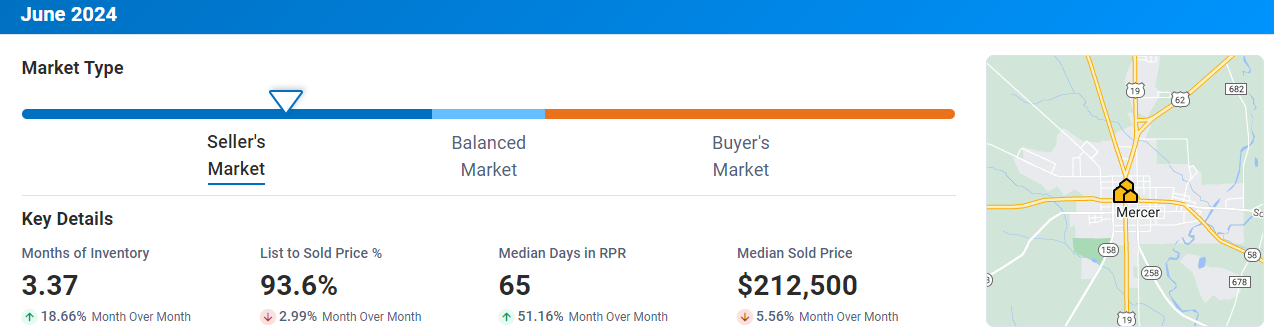
In Mercer County, while there is an increase in the number of homes sold and active listings, the median sold price and list-to-sold price ratio have decreased.
Montgomery County, PA
- Median Sold Price: $475,000 (up 3.26% month-over-month)
- Homes Sold: 818 (up 4.1% month-over-month)
- Active Listings: 948 (down 1.9% month-over-month)
- Median Days in RPR: 8 days (up 14.29% month-over-month)
- List to Sold Price Ratio: 102.7% (up 0.29% month-over-month)
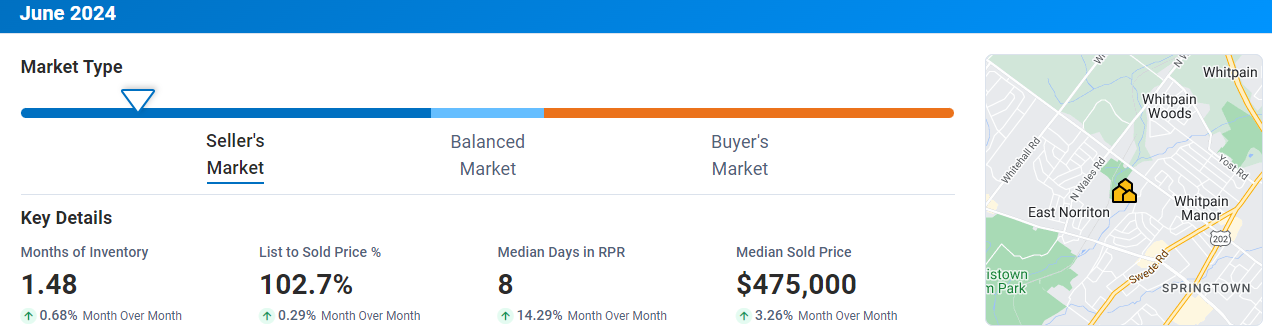
Montgomery County shows an upward trend in median sold prices and homes sold, with a slight decrease in active listings.
Philadelphia, PA
- Median Sold Price: $285,000 (up 5.56% month-over-month)
- Homes Sold: 1,164 (down 18.3% month-over-month)
- Active Listings: 3,925 (up 1.9% month-over-month)
- Median Days in RPR: 25 days (down 10.71% month-over-month)
- List to Sold Price Ratio: 98.4% (down 2.03% month-over-month)
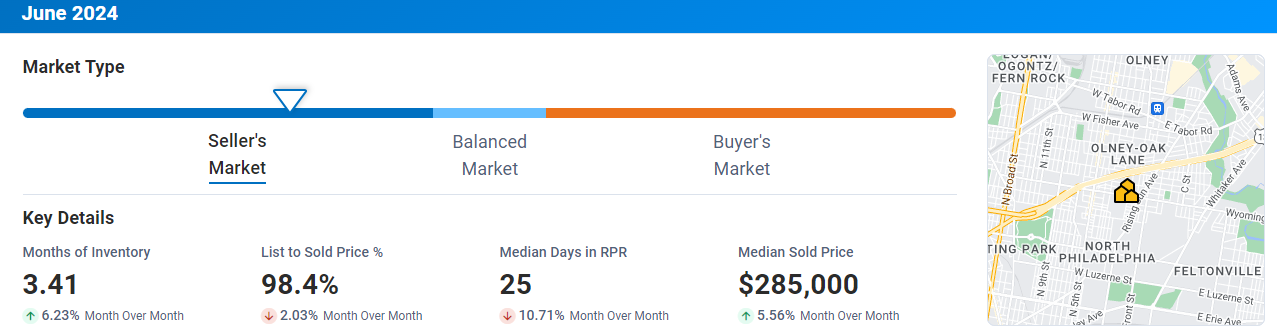
Philadelphia’s real estate market shows an increase in median sold prices and active listings, while the number of homes sold has declined significantly.
Atlantic County, NJ
- Median Sold Price: $341,995 (down 6.3% month-over-month)
- Homes Sold: 273 (down 16.3% month-over-month)
- Active Listings: 973 (up 6.2% month-over-month)
- Median Days in RPR: 20 days (up 11.11% month-over-month)
- List to Sold Price Ratio: 98.4% (down 0.66% month-over-month)
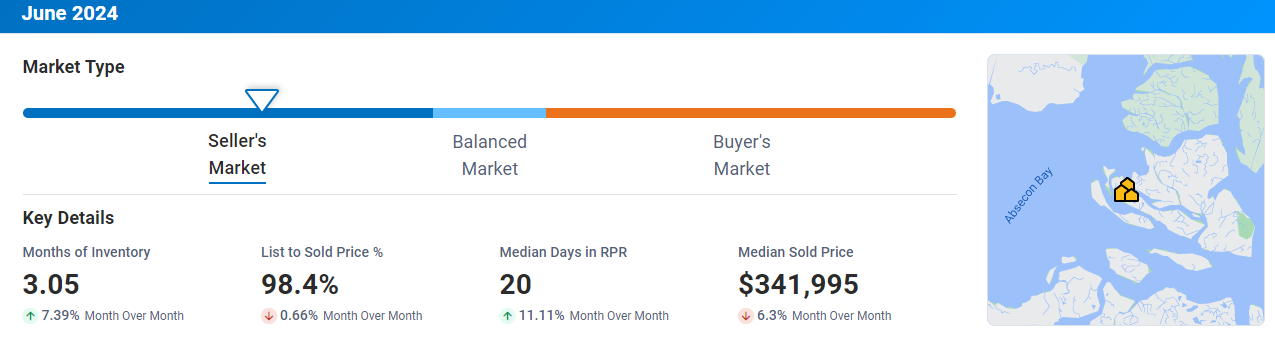
In Atlantic County, NJ, both median sold prices and homes sold have decreased, while active listings have increased.
Ocean County, NJ
- Median Sold Price: $460,500 (up 0.11% month-over-month)
- Homes Sold: 773 (down 17.9% month-over-month)
- Active Listings: 2,051 (down 10.3% month-over-month)
- Median Days in RPR: 21 (down 8.7% month-over-month)
- List to Sold Price Ratio: 100% (down 0.19% month-over-month)
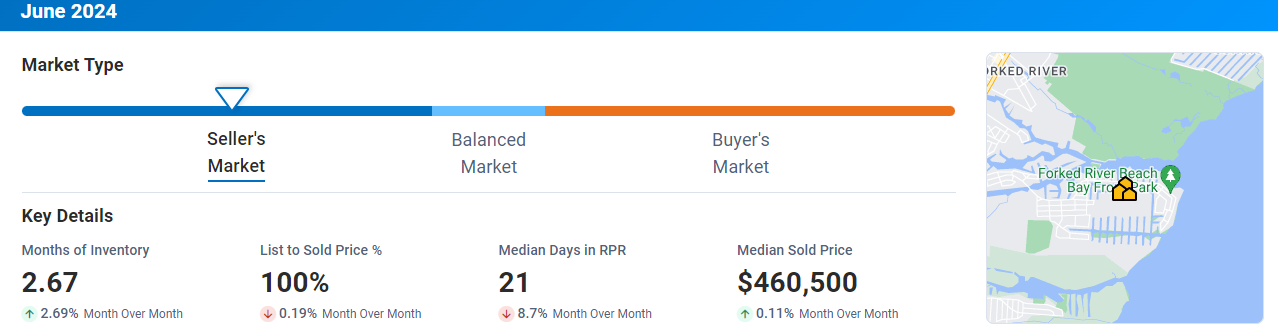
Ocean County, NJ, saw a decrease in homes sold and active listings, with a stable median sold price and a slight decrease in the list-to-sold price ratio.
Cape May, NJ
- Median Sold Price: $694,950 (up 7.08% month-over-month)
- Homes Sold: 23
- Active Listings: 90 (down 11.8% month-over-month)
- Median Days in RPR: 30 (down 6.25% month-over-month)
- List to Sold Price Ratio: 98.4% (up 2.01% month-over-month)
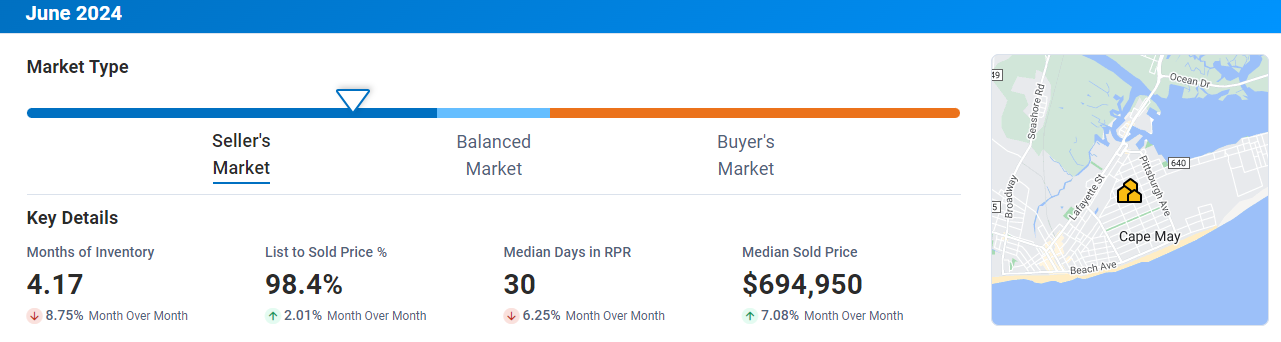
Cape May, NJ, experienced a significant increase in median sold prices, with a decrease in active listings and median days in RPR.
Greater Lehigh Valley Realtors (GLVR)
- Median Sold Price: $361,100
- Homes Sold: 591
- Active Listings: 664
- Average Days on Market (DOM): 15 days
- List to Sold Price Ratio: 102.3%

The Greater Lehigh Valley Realtors (GLVR) data shows a healthy real estate market with a strong list-to-sold price ratio.
Conclusion
These insights highlight the dynamic nature of the real estate market across different counties, showcasing varying trends in median sold prices, homes sold, and active listings.


