
 Facebook
 X
X
 Pinterest
 Copy Link
Real Estate Market: January 2023 VS January 2024
Hey there, folks! Let’s take a stroll through the real estate market and compare how January 2023 stacks up against January 2024. Buckle up, because we’re diving into the nitty-gritty of inventory movement, sold units, pending contracts, pricing trends, and more!
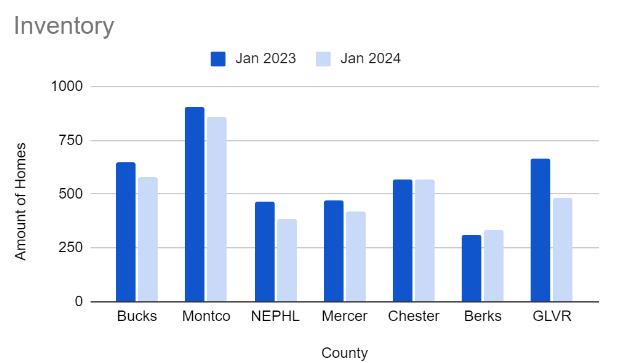
Market Inventory Movement:
So, first up on our radar is inventory movement. It seems like across the board, we’re seeing a bit of a dip in inventory movement compared to last year, except for Berks and Chester counties, where things are holding steady. This could mean a tougher hunt for that dream property, but hey, there’s always a silver lining – some regions are showing signs of resilience, so hang in there!
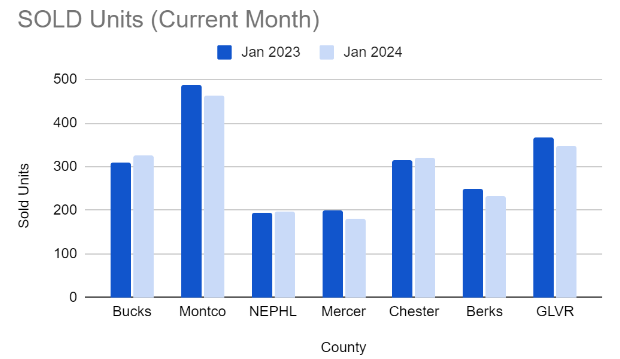
Sold Units:
Now, let’s talk sold units. While some markets are reporting a bit of a slowdown, Bucks, Northeast Philadelphia (NEPHL), and Chester are the stars of the show with positive unit sales. It’s like they’ve got their own little real estate party going on! And hey, overall, it looks like the sales activity is starting to stabilize in a good chunk of the markets. Progress, people!
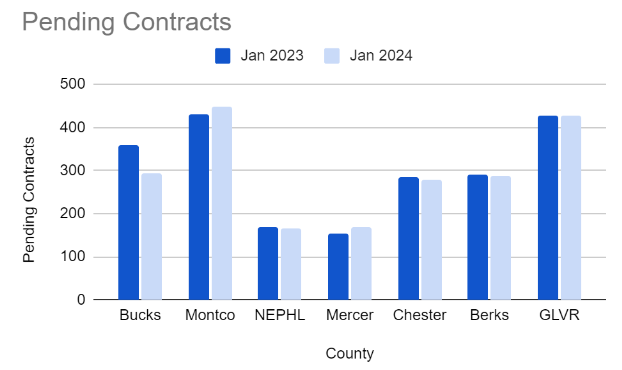
Pending Contracts:
Ah, pending contracts – the mysterious middle ground between “yes” and “not quite yet.” It’s a mixed bag out there, with changes ranging from single to double digits. It just goes to show that the real estate market dances to its own beat, influenced by all sorts of factors. Keep your eyes peeled for those twists and turns!
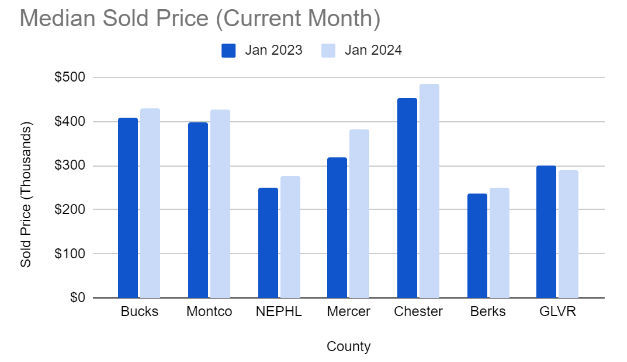
Pricing Trends in the Market:
Now, onto pricing trends. Most markets are seeing modest price bumps, but the Greater Lehigh Valley (GLVR) is keeping it chill with relatively flat pricing trends. Every market’s got its own rhythm, right? It’s like a symphony of supply and demand, playing out differently in each area. So, whether you’re buying or selling, knowing these trends can be your secret weapon.
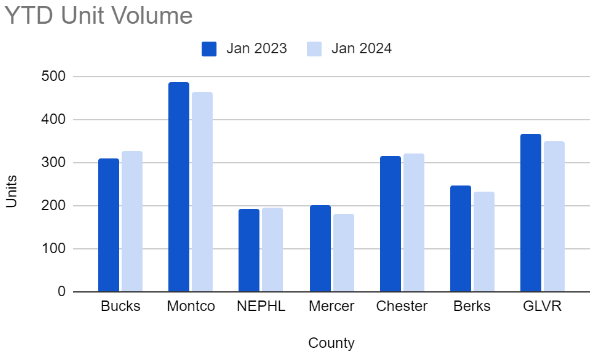
Year-To-Date Unit Volume:
YTD unit volume – sounds fancy, doesn’t it? It’s basically the story of how many properties have changed hands over time. Tracking this gives us a big-picture view of market activity, helping us spot trends and shifts. It’s like connecting the dots to see the bigger picture – pretty cool, huh?
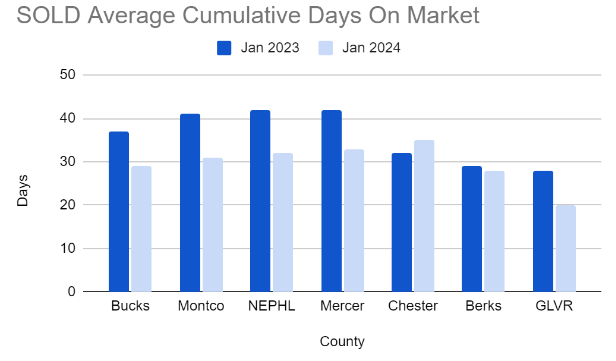
Sold Days on Market:
Sold DOM (Days on Market) – the countdown clock for sellers. Looks like homes are flying off the shelves faster in most markets, except for Chester County, where things are taking a tad longer. It’s like a game of musical chairs out there – you snooze, you lose!
Check out more from CBHearthside here: https://linktr.ee/coldwellbankerhearthside
To look at our other blogs, visit: https://cbhre.com/blog


