Real Estate Market Trends in Various Counties
As we navigate through the real estate market data for different counties, some interesting trends emerge. Here’s a closer look at the latest statistics:
Berks County, PA
- Median Sold Price: $282,450 (down 0.63% month-over-month)
- Homes Sold: 338 (down 14.4% month-over-month)
- Active Listings: 372 (up 12.4% month-over-month)
- Median Days in RPR: 6 days
- List to Sold Price Ratio: 101.6% (up 0.4% month-over-month)

The real estate market in Berks County shows a slight decrease in median sold prices and the number of homes sold. However, there’s an increase in active listings and the list-to-sold price ratio.
Bucks County, PA
- Median Sold Price: $525,000 (up 5.37% month-over-month)
- Homes Sold: 500 (down 4.6% month-over-month)
- Active Listings: 712 (down 3.3% month-over-month)
- Median Days in RPR: 9 days
- List to Sold Price Ratio: 101.8% (up 0.02% month-over-month)

Bucks County experienced a notable increase in median sold prices, despite a slight decrease in homes sold and active listings. The list-to-sold price ratio also saw an uptick.
Chester County, PA
- Median Sold Price: $575,000 (up 4.55% month-over-month)
- Homes Sold: 580 (up 19.3% month-over-month)
- Active Listings: 641 (up 5.1% month-over-month)
- Median Days in RPR: 6 days (up 20% month-over-month)
- List to Sold Price Ratio: 103.7% (down 0.13% month-over-month)

Chester County shows a strong performance with increases in median sold prices, homes sold, and active listings. However, the list-to-sold price ratio slightly declined.
Lehigh Valley, PA
- Median Sold Price: $361,100 (up 10.83% month-over-month)
- Homes Sold: 345 (up 1.8% month-over-month)
- Active Listings: 411 (up 6.5% month-over-month)
- Median Days in RPR: 8 days (up 14.29% month-over-month)
- List to Sold Price Ratio: 102.4% (up 0.31% month-over-month)

Lehigh Valley demonstrates significant growth in median sold prices and a steady increase in homes sold and active listings. The list-to-sold price ratio also rose notably.
Mercer County, PA
- Median Sold Price: $212,500 (down 5.56% month-over-month)
- Homes Sold: 11 (up 37.5% month-over-month)
- Active Listings: 25 (up 13.6% month-over-month)
- Median Days in RPR: 65 days (up 51.16% month-over-month)
- List to Sold Price Ratio: 93.6% (down 2.99% month-over-month)

In Mercer County, while there is an increase in the number of homes sold and active listings, the median sold price and list-to-sold price ratio have decreased.
Montgomery County, PA
- Median Sold Price: $475,000 (up 3.26% month-over-month)
- Homes Sold: 818 (up 4.1% month-over-month)
- Active Listings: 948 (down 1.9% month-over-month)
- Median Days in RPR: 8 days (up 14.29% month-over-month)
- List to Sold Price Ratio: 102.7% (up 0.29% month-over-month)

Montgomery County shows an upward trend in median sold prices and homes sold, with a slight decrease in active listings.
Philadelphia, PA
- Median Sold Price: $285,000 (up 5.56% month-over-month)
- Homes Sold: 1,164 (down 18.3% month-over-month)
- Active Listings: 3,925 (up 1.9% month-over-month)
- Median Days in RPR: 25 days (down 10.71% month-over-month)
- List to Sold Price Ratio: 98.4% (down 2.03% month-over-month)

Philadelphia’s real estate market shows an increase in median sold prices and active listings, while the number of homes sold has declined significantly.
Atlantic County, NJ
- Median Sold Price: $341,995 (down 6.3% month-over-month)
- Homes Sold: 273 (down 16.3% month-over-month)
- Active Listings: 973 (up 6.2% month-over-month)
- Median Days in RPR: 20 days (up 11.11% month-over-month)
- List to Sold Price Ratio: 98.4% (down 0.66% month-over-month)

In Atlantic County, NJ, both median sold prices and homes sold have decreased, while active listings have increased.
Ocean County, NJ
- Median Sold Price: $460,500 (up 0.11% month-over-month)
- Homes Sold: 773 (down 17.9% month-over-month)
- Active Listings: 2,051 (down 10.3% month-over-month)
- Median Days in RPR: 21 (down 8.7% month-over-month)
- List to Sold Price Ratio: 100% (down 0.19% month-over-month)

Ocean County, NJ, saw a decrease in homes sold and active listings, with a stable median sold price and a slight decrease in the list-to-sold price ratio.
Cape May, NJ
- Median Sold Price: $694,950 (up 7.08% month-over-month)
- Homes Sold: 23
- Active Listings: 90 (down 11.8% month-over-month)
- Median Days in RPR: 30 (down 6.25% month-over-month)
- List to Sold Price Ratio: 98.4% (up 2.01% month-over-month)

Cape May, NJ, experienced a significant increase in median sold prices, with a decrease in active listings and median days in RPR.
Greater Lehigh Valley Realtors (GLVR)
- Median Sold Price: $361,100
- Homes Sold: 591
- Active Listings: 664
- Average Days on Market (DOM): 15 days
- List to Sold Price Ratio: 102.3%
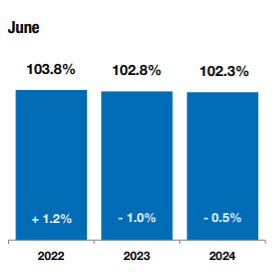
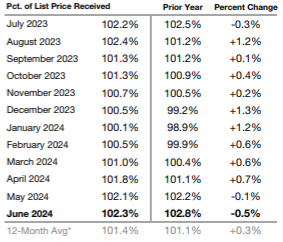
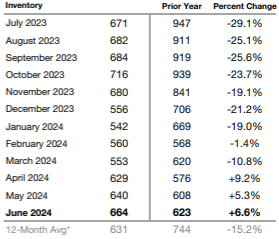
The Greater Lehigh Valley Realtors (GLVR) data shows a healthy real estate market with a strong list-to-sold price ratio.
Conclusion
These insights highlight the dynamic nature of the real estate market across different counties, showcasing varying trends in median sold prices, homes sold, and active listings.

 Facebook
 X
X
 Pinterest
 Copy Link


