
 Facebook
 X
X
 Pinterest
 Copy Link
Real Estate Market: February 2023 VS February 2024
Hey there, fellow real estate enthusiasts! Welcome back to our monthly get-together where we dissect the latest happenings in the ever-dynamic world of real estate. Today, we’re diving headfirst into February’s market report, unpacking all the juicy details and uncovering what this means for buyers, sellers, and investors alike. So, grab your favorite beverage, settle in, and let’s embark on this journey together!
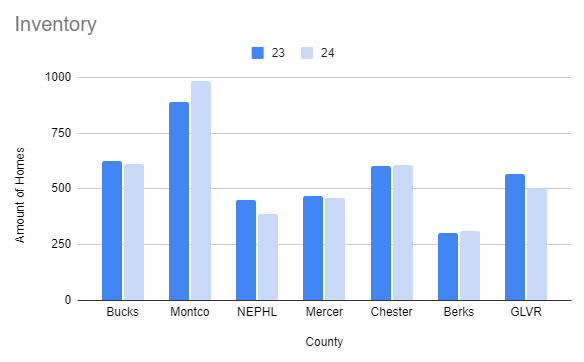
Inventory Movement:
Let’s kick things off with a glimpse into the pulse of inventory movement. The good news? Market rates of movement are painting a promising picture. What does this mean exactly? Well, it boils down to this: the rates of decline have lessened, and in some cases, we’re even witnessing inventory growth. It’s like a ray of sunshine breaking through the clouds, signaling a positive shift in the real estate landscape. Take Bucks, Mercer, and Berks counties, for example – they’re leading the charge with notable improvements in this department.
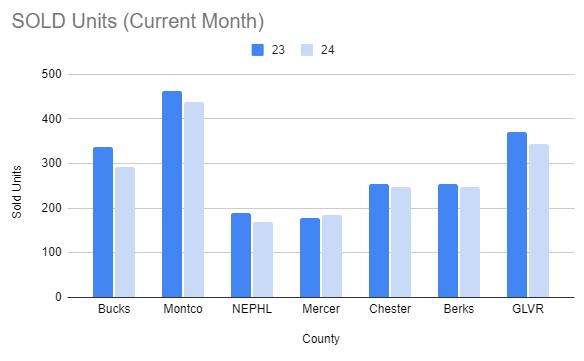
Sold Units:
Now, onto sold units. While February saw numerous markets reporting dampened monthly results, there’s still reason to keep the faith. Sure, the rates of decline vary, but amidst the flux, there’s room for optimism. From Bucks to Mercer, Montco to NEPHL, each market is charting its unique course, showcasing the diverse dynamics at play.
Pending Contracts:
Ah, pending contracts – the tantalizing glimpse into future transactions. Here’s the scoop: most markets are reflecting an improving picture year over year. Whether it’s Bucks with a slight decline or Montco with a significant uptick, the overall trend is positive. It’s like watching the gears of progress slowly but surely turn towards brighter horizons.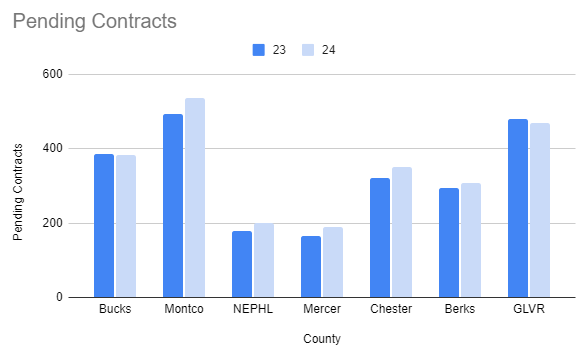
Pricing Trends:
Now, let’s talk numbers – pricing trends, to be exact. February brought with it a mixed bag of results, with most tracked markets experiencing moderate price increases. From Bucks to Mercer, NEPHL to Chester, each market is carving out its unique path in response to supply and demand dynamics.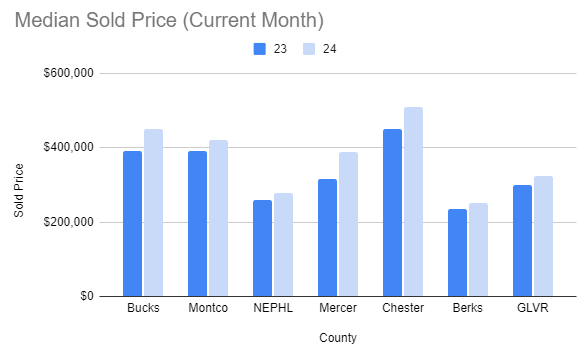
Year-to-Date Unit Volume:
As we delve deeper into the year-to-date unit volume, we’re met with a mixed bag of results. While most markets are reporting dampened figures, there’s a notable improvement in the rate of decline year over year. It’s like witnessing a phoenix rise from the ashes – a testament to the resilience of the real estate market.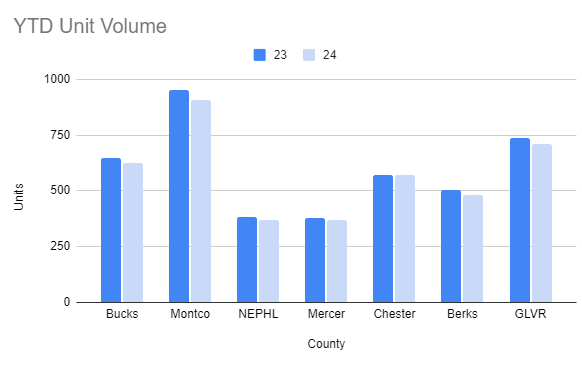
Sold Days on Market:
Homes are flying off the shelves at a faster pace in most markets, indicating decreased selling time year over year. This marks a significant shift from what we observed throughout 2023, highlighting the evolving nature of buyer behavior and market dynamics.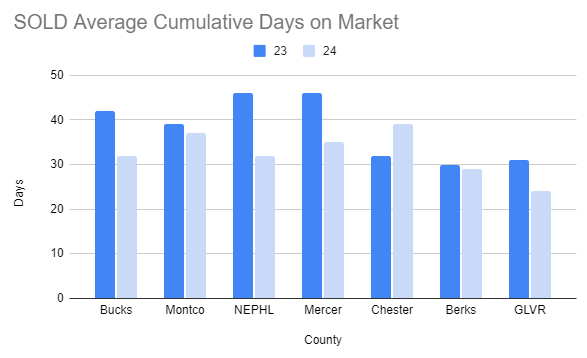
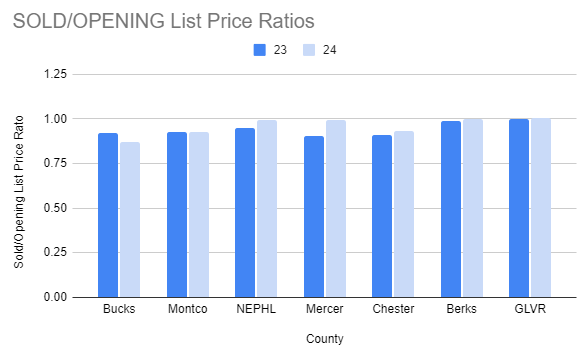
Sold/Opening List Price Ratios:
Last but not least, let’s discuss sold/opening list price ratios. This metric provides insights into the fluctuating price increase trend and buyer demand. From Bucks to GLVR, each market’s results correlate with its unique pricing dynamics, signaling a shift in seller pricing advantage.
In conclusion, February’s market report paints a nuanced picture of the real estate landscape. While challenges remain, there’s a sense of cautious optimism in the air. From improving inventory movement to resilient pricing trends, each data point offers valuable insights for navigating today’s market with confidence. So, here’s to staying informed, staying adaptable, and seizing those opportunities as they arise. Until next time, happy house hunting (or selling)!
Take a look at last month’s market report, here: https://cbhre.com/2024/02/20/january-2024-market-statistics
Check out more from CBHearthside here: https://linktr.ee/coldwellbankerhearthside
To look at our other blogs, visit: https://cbhre.com/blog


