
 Facebook
 X
X
 Pinterest
 Copy Link
March 2025 Market Statistics

Real Estate Market– March 2025
Your Local Update Across PA & NJ
The spring market is off to a dynamic start across Pennsylvania and New Jersey. While some counties are seeing strong momentum in pricing and buyer activity, others are navigating shifts in inventory and days on market. Here’s a breakdown of what’s happening in each local market we serve:
Bucks County, PA
Bucks County saw a 3.1% increase in median sold price, reaching $467,000. While the number of homes sold dipped slightly by 1.1%, the market experienced a healthy rise in available inventory—active listings are up 12.5%, giving buyers more choices. Homes spent an average of just 9 days on the market, one day longer than the previous year. Notably, sellers are seeing strong returns, with the list to sold price ratio climbing to 100.5%, a 1.06% increase month over month—indicating that many homes are selling above asking.
Montgomery County, PA
Montgomery County’s market continues to show resilience, with the median sold price up 3.8% to $440,000. Though home sales declined 4.8% year over year, inventory has increased by 7.8%, helping to balance supply and demand. Homes are moving quickly with a median of just 8 days on market, up one day from last year. Sellers are in a strong position, with a list to sold price ratio of 101.3%, up 1.84% from last month—suggesting competitive bidding continues in many areas.
Berks County, PA
Berks County experienced robust price growth, with the median sold price jumping 7.8% to $274,950. Home sales were also up by 5.4%, showing buyer demand remains strong. Active listings rose slightly by 1.5%, while the average days on market crept up by 2 days to 10. The list to sold price ratio saw a slight decline month over month, down 1.76% to 99.7%, though still reflecting near-full asking price sales.
Philadelphia County, PA
Philadelphia’s market delivered a 7.7% increase in median sold price, now at $280,000. Despite a 2.5% dip in homes sold, inventory rose by 8.2%, totaling over 4,100 active listings. Buyers appear to be moving quickly, with days on market down by 5 days to an average of 26. The list to sold price ratio improved slightly to 98.2%, up 0.77% from the previous month.
Chester County, PA
Chester County continues to thrive with steady home values. The median sold price held firm at $500,000. Sales volume increased 5.4%, and inventory surged 21.1%—a welcome shift for buyers seeking more options. Homes are selling swiftly, with a median of just 6 days on the market, unchanged from last year. The list to sold price ratio rose to 101.8%, up 0.91% month over month, confirming that well-priced homes are often drawing competitive offers.
GLVR (Lehigh Valley, PA)
The Lehigh Valley market posted a 4.3% year-over-year increase in median sold price, bringing it to $350,000. However, home sales dropped 7.8% while inventory declined significantly by 14.4%. Homes are taking longer to sell, with average days on market up 34.8% to 31. The list to sold price ratio dipped slightly year over year to 100%, but overall, the market remains stable despite tighter supply.
Ocean County, NJ
In Ocean County, the median sold price dipped 0.9% to $525,000, while the number of homes sold climbed by 6.9%. Active listings rose by 13.3%, giving buyers more options heading into spring. Homes are selling faster, with the median days on market down by 9 days to just 30. Sellers continue to fare well with a list to sold price ratio of 98.8%, up 0.16% month over month.
Mercer County, NJ
Mercer County saw solid gains across most metrics, with a 6.6% increase in median sold price to $405,000 and a 2.5% uptick in home sales. Inventory jumped significantly by 44.8%, providing more balance to the market. Homes spent an average of 20 days on market, 5 days more than last year. The list to sold price ratio remains strong at 101%, despite a small month-over-month dip of 0.1%.
Hunterdon County, NJ
Hunterdon County saw a notable shift this month, with the median sold price falling by 20.3% to $434,500—likely due to the limited number of homes sold. That said, sales volume increased 20%, while inventory decreased by 16.7%. Days on market shortened by 5 days to 14, suggesting faster-moving transactions. Sellers are still seeing strong results, with a list to sold price ratio of 102.2%, up 1.27% month over month, one of the highest in the region.
Final Thoughts
Across the board, many markets are welcoming increased inventory and rising price trends, with several areas showing strong competition among buyers. Whether you’re considering buying, selling, or investing this season, understanding your local market is key. Reach out to your Coldwell Banker Hearthside professionals for expert insights and guidance tailored to your goals.
Check out more about CBH, HERE!
Check out last month’s report: HERE!
February 2025 Market Statistics

Real Estate Market Trends Across PA and NJ
As we move further into 2025, the real estate market continues to evolve, with some areas seeing price appreciation while others experience shifts in inventory and sales volume. Here’s a detailed look at how different counties in Pennsylvania and New Jersey performed in February 2025.
Bucks County, PA
Bucks County’s real estate market showed steady growth, with the median sold price rising to $460,000, a 2.2% increase from last year. The number of homes sold climbed 4.8% to 305, signaling a healthy demand. Inventory expanded significantly, with active listings up 16.2% to 546, offering buyers more options. The median days on market (DOM) increased slightly to 12 days, up by just two days from the previous year. Meanwhile, the list-to-sold price ratio dipped marginally to 99.5%, reflecting a slight 0.36% month-over-month decline.
Montgomery County, PA
Montgomery County experienced a strong price increase, with the median sold price reaching $447,000, up 6.4% from last year. Sales volume also grew, with 448 homes sold, a 3.2% year-over-year rise. However, active listings dropped 7.6% to 725, indicating a tighter market. Homes took an average of 19 days to sell, eight days longer than last year, showing a shift in buyer behavior. The list-to-sold price ratio remained stable at 99.5%, down slightly by 0.06% from last month.
Berks County, PA
The median sold price in Berks County rose 4% to $260,000, reflecting continued appreciation. However, home sales dropped significantly by 17.2%, with only 202 homes sold in February. Inventory saw a modest 6.2% increase, with 309 active listings available. Homes spent an average of 11 days on the market, unchanged from last year. The list-to-sold price ratio jumped to 101.4%, a notable 1.26% increase from the previous month, suggesting buyers are competing aggressively for available homes.
Philadelphia, PA
Philadelphia’s housing market continued its upward price trend, with the median sold price rising 4% to $260,000. However, the number of homes sold fell 5.9% to 796, indicating a slight slowdown in transactions. Active listings increased 5.9% to 4,060, expanding buyer options. The median DOM extended by six days to 44, showing a slight cooling of demand. The list-to-sold price ratio edged up to 97.5%, reflecting a 0.06% month-over-month increase.
Chester County, PA
Chester County saw a dip in its median sold price, decreasing 2.3% to $495,000. Despite the price drop, home sales surged 15% to 283, indicating strong buyer interest. Active listings saw a dramatic 25.7% increase, reaching 606 homes on the market. The median DOM remained steady at 11 days, showing no significant change in market speed. The list-to-sold price ratio rose to 100.4%, up 0.63% month-over-month, highlighting a competitive environment.
Greater Lehigh Valley (GLVR)
The Greater Lehigh Valley experienced strong price growth, with the median sold price jumping 9.7% year-over-year to $350,000. Sales increased by 2.2% to 369, while active listings dropped 10% to 548, tightening market conditions. The average DOM increased by 29.2% to 31 days, indicating that homes are taking longer to sell. The list-to-sold price ratio dipped slightly to 100.2%, down 0.3% year-over-year.
Ocean County, NJ
Ocean County saw significant price appreciation, with the median sold price rising 13.6% to $510,000. Home sales increased by 3.8% to 109, while active listings climbed 8.2% to 407. The median DOM rose slightly to 40 days, up by four days compared to last year. The list-to-sold price ratio declined slightly to 98.7%, reflecting a 0.31% month-over-month drop.
Mercer County, NJ
Mercer County’s median sold price rose 7.7% to $420,000, reflecting continued market strength. However, home sales dropped 19.3% to 146, suggesting a potential slowdown in buyer activity. Active listings surged 38.4% to 440, increasing available inventory. The median DOM rose significantly by 17 days to 35, indicating longer selling times. Meanwhile, the list-to-sold price ratio jumped to 101.3%, a 1.6% month-over-month increase, showing that homes are still fetching competitive prices.
Hunterdon County, NJ
Hunterdon County witnessed a remarkable price surge, with the median sold price skyrocketing 161.2% to $1,580,000. However, home sales declined sharply, with only five transactions recorded—a 44.4% drop. Active listings also fell 31% to just 29 homes on the market, creating an extremely limited inventory. Homes took an average of 106 days to sell, up 90 days from last year, indicating a dramatic slowdown. The list-to-sold price ratio rose to 100.7%, up 2.08% month-over-month, showing that despite long market times, homes are still selling near their asking prices.
Final Thoughts Regarding this Market
February 2025’s real estate market continues to show mixed trends, with price growth in most areas but variations in sales volume and inventory levels. While some counties, like Hunterdon, saw dramatic price increases, others, like Chester, experienced slight declines. Inventory remains a critical factor in shaping market conditions, and as we move into the spring season, it will be crucial to watch how demand and supply balance out. Whether you’re a buyer or seller, understanding these local trends will help you make informed real estate decisions.
Check out more about CBH, HERE!
Check out last month’s report: HERE!
January 2025 Market Statistics

The real estate market in Pennsylvania and New Jersey saw a mix of rising home prices, shifting inventory levels, and changes in buyer behavior throughout January 2025. While some counties experienced strong price growth, others saw slower sales and longer days on the market. Here’s a closer look at the trends across key regions.
Bucks County, PA
Bucks County led the region in price appreciation, with the median home price jumping 15.1% to $495,000 year-over-year. The market remained active, with 346 homes sold, up 7.5% from last year. Inventory increased, with 519 active listings, reflecting a 9% gain. Despite a rise in available homes, demand kept pace, as the median days on market remained unchanged at just 12 days. The list-to-sold price ratio stayed firm at 99.5%, keeping sellers in a strong negotiating position.
Montgomery County, PA
Montgomery County saw modest price growth, with the median sold price rising 1.9% year-over-year to $436,000. Buyer activity was strong, with 512 homes sold, marking an 11.3% increase. Inventory remained stable, with 713 active listings, down only 0.3%. Homes are taking longer to sell, as the median days on market increased by five days to 15. Despite this, sellers are still closing deals at 99.3% of asking price, indicating a balanced market.
Berks County, PA
Berks County’s market remained competitive, with the median sold price climbing 11.8% year-over-year to $280,000. Sales activity was nearly unchanged, with 232 homes sold, down just 0.9%. Inventory expanded, with 338 active listings, an 8.3% increase. Homes are still selling relatively quickly, though the median days on market increased by four days to 13. Sellers remain in control, with the list-to-sold price ratio at 100.3%, showing that many homes are selling at or above asking price.
Philadelphia (PHL)
Philadelphia saw a slight dip in median home prices, down 0.5% year-over-year to $250,000, but demand remained steady. The number of homes sold increased by 4.5%, reaching 877 transactions. Inventory remained stable, with 3,786 active listings, up 0.5%. Homes are moving more quickly, as the median days on market dropped by four days to 32. Sellers are still seeing strong offers, though the list-to-sold price ratio sits at 97.8%, indicating buyers may be negotiating slightly more than in other markets.
Chester County, PA
Chester County’s market remained strong, with the median home price rising 5.7% year-over-year to $510,000. Buyer activity was consistent, with 315 homes sold, up 1%. Inventory grew, with 568 active listings, a 19.1% increase. Homes are still selling quickly, as the median days on market dropped by one day to 11. Sellers continue to benefit, with the list-to-sold price ratio holding at 100%, meaning homes are selling at full asking price.
Greater Lehigh Valley (GLVR)
The Greater Lehigh Valley market showed continued strength as home prices rose 8.6% year-over-year to a median of $315,000. Buyer demand remained solid, with 396 homes sold, a 7% increase compared to last year. However, inventory tightened slightly, with 554 active listings, marking a 3.1% decrease. Homes are taking longer to sell, with the median days on market increasing by 19% to 25 days. Despite rising prices, sellers are adjusting slightly, with the list-to-sold price ratio declining to 99.5%.
Ocean County, NJ
Ocean County’s market continues to favor sellers, with the median sold price rising 10% year-over-year to $494,900. However, home sales declined by 13.7%, with only 120 homes sold, suggesting buyers may be hesitating at higher price points. Inventory remains steady, with active listings up slightly by 1.3% to 377 homes. Homes are taking a bit longer to sell, as the median days on market increased by four days to 24. The list-to-sold price ratio stands strong at 100.4%, meaning sellers are still achieving top dollar for their properties.
Mercer County, NJ
Mercer County experienced a 5.8% increase in median home prices, reaching $407,500. However, sales activity slowed slightly, with 177 homes sold, down 1.7% from last year. Inventory is growing, with active listings increasing by 20.7% to 373, giving buyers more options. The market is shifting, as homes are now taking a median of 30 days to sell, up 14 days compared to last year. Sellers are still receiving competitive offers, with the list-to-sold price ratio holding at 99.6%.
Hunterdon County, NJ
Hunterdon County saw the most dramatic price increase, with the median sold price skyrocketing 57.8% year-over-year to $915,000. Sales activity surged as well, with 11 homes sold, marking a 57.1% increase. Inventory, however, declined slightly, with 37 active listings, down 9.8%. Homes are taking longer to sell, with the median days on market rising by eight days to 32. Sellers are still commanding strong offers, with the list-to-sold price ratio at 99.1%.
Market Outlook for 2025
As we move into 2025, home prices remain strong across most counties, with rising values in Bucks, Hunterdon, and Ocean Counties. However, sales volume is declining in several areas, and homes are beginning to take longer to sell, signaling a potential market shift. Inventory levels are mixed, with some areas seeing increases that could benefit buyers in the coming months.
Overall, sellers are still receiving strong offers, with list-to-sold price ratios holding above 99% in most regions. While buyers may be gaining a slight advantage in terms of negotiating time, the market remains competitive. If you’re considering buying or selling, staying informed about these trends will be key to making the right move in 2025.
August 2024 Market Statistics

Local Real Estate Market Snapshot
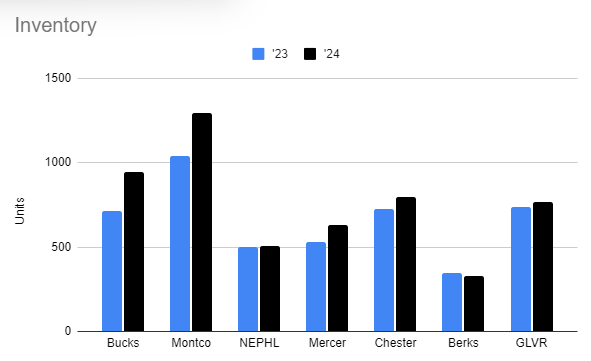
Bucks County
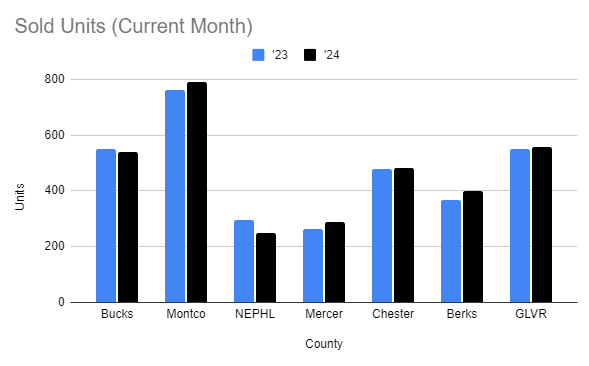
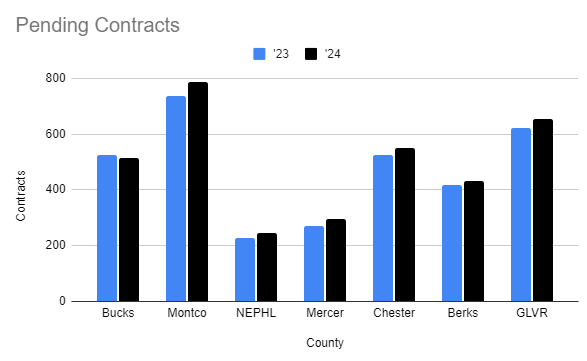
Bucks County has seen a significant increase in inventory, with a 36.5% rise year-over-year, bringing available homes to 980 in August 2024 compared to 718 in 2023. Despite more available homes, sold units dropped by 5.9%, with 603 homes sold. Pending contracts rose by 8.2%, signaling a potential increase in future sales.
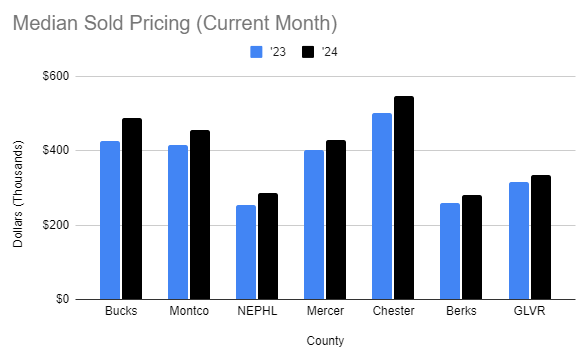
Median sold prices increased by 7.9%, now at $510,000. Homes are moving slightly faster with an average of 26 days on market (CDOM) compared to 28 last year, and sellers are getting close to their asking prices, with the list-to-sold price ratio at 96.0%, a slight drop from 97.2% in 2023.
Montgomery County (Montco)
Montgomery County experienced a 27.8% rise in inventory, reaching 1305 homes, alongside a 9.3% increase in sold units (897 homes). Pending contracts also saw a 2.1% uptick, showing a steady flow of buyer activity.
Median sold prices increased by 3.2%, now at $465,000, with homes taking slightly longer to sell at 30 days, up from 28. The sold-to-list price ratio dipped to 94.8% from 97.6%, reflecting slightly less seller leverage.
Chester County
In Chester County, inventory rose by 26.1% to 908 homes, though the number of sold units dropped by 8.1% to 569. Pending contracts decreased by 6.4%, indicating a slight slowdown in future sales.
Median home prices showed a small increase of 0.9% to $535,000. Homes sold in an average of 24 days, slightly faster than the previous year. The sold-to-list price ratio remained unchanged at 98.1%, indicating a stable seller’s market.
Berks County
Berks County reported a 4.8% increase in inventory, reaching 417 homes, with sold units rising by 2.5% to 410 homes. Pending contracts also rose by 3.1%, suggesting steady demand.
Home prices increased by 7.6% to $285,300. The average days on market increased slightly to 24 days, and the sold-to-list price ratio dropped to 98.2%, down from 100.0% last year.
Northeast Philadelphia (NEPHL)
NE Philadelphia saw a 12.4% increase in inventory, with 500 homes available, but a 5.0% decline in sold units to 247 homes. Pending contracts grew by 2.9%, indicating a potential increase in sales soon.
Median sold prices increased by 5.6% to $290,000. Homes are selling faster, with the average days on market dropping to 31 days from 36. The sold-to-list price ratio inched up to 96.6% from 96.4%.
Mercer County
Mercer County was a standout performer, with a 23.5% increase in inventory, reaching 689 homes. However, sold units decreased by 9.4% to 317 homes. Pending contracts showed strong growth, rising by 18.4%, signaling a potential uptick in future sales.
Home prices jumped by 10.0%, reaching a median of $467,000. Homes sold faster, with an average of 29 days on the market, and the sold-to-list price ratio improved to 98.9%, reflecting strong demand.
Greater Lehigh Valley Region (GLVR)
GLVR saw a 12.0% increase in inventory, with 768 homes available, but sold units declined by 9.7%. However, pending contracts rose by 7.9%, suggesting potential growth in sales.
The median sold price increased by 4.2% to $345,000, with homes taking an average of 16 days to sell. The sold-to-list price ratio remains strong at 101.1%, though it has dropped slightly from 102.4% in 2023.
Month-Over-Month Updates for Southern New Jersey Areas
Cape May County, NJ
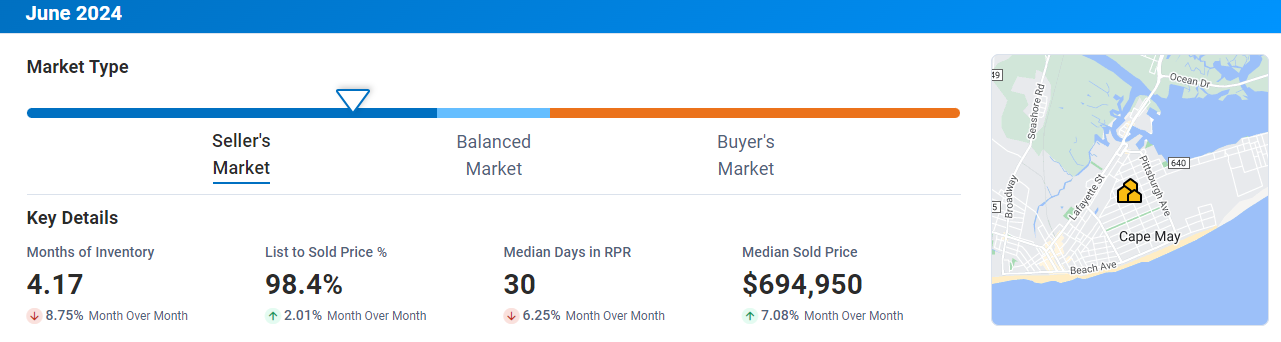
Cape May County’s market continues to heat up. The median sold price increased significantly by 29.92%, reaching $692,500 in August 2024. Homes sold jumped by 25%, with 30 homes sold compared to the previous month. Inventory also increased by 11.5%, with 97 active listings, giving buyers more options.
Homes are selling faster, with the average days on market (CDOM) dropping by 25% to 24 days. The list-to-sold price ratio improved to 98.4%, up by 1.55%, showing that sellers are receiving offers close to their asking prices.
Ocean County, NJ
In contrast, Ocean County saw a slight cooling. The median sold price dropped by 2.11%, settling at $465,000. The number of homes sold also decreased by 1.9%, with 858 homes sold in August 2024. Active listings experienced a significant decrease of 21.8%, bringing the total to 5,219 homes.
Homes are staying on the market slightly longer, with the average DOM increasing by 4% to 26 days. The list-to-sold price ratio dropped in line with median prices, reflecting a softening market.
Atlantic County, NJ
Atlantic County’s market showed a mix of positive and negative changes. The median sold price surged by 11.03% to $365,300, while the number of homes sold dipped by 1.1% to 271. Inventory increased by 5.6%, with 1,042 active listings.
Homes are taking longer to sell, with the average DOM rising by 13.04% to 26 days. Despite this, the list-to-sold price ratio improved to 99%, up by 0.72%, reflecting continued buyer interest.
Market Summary by Category
Across all these regions, there are a few key trends to note:
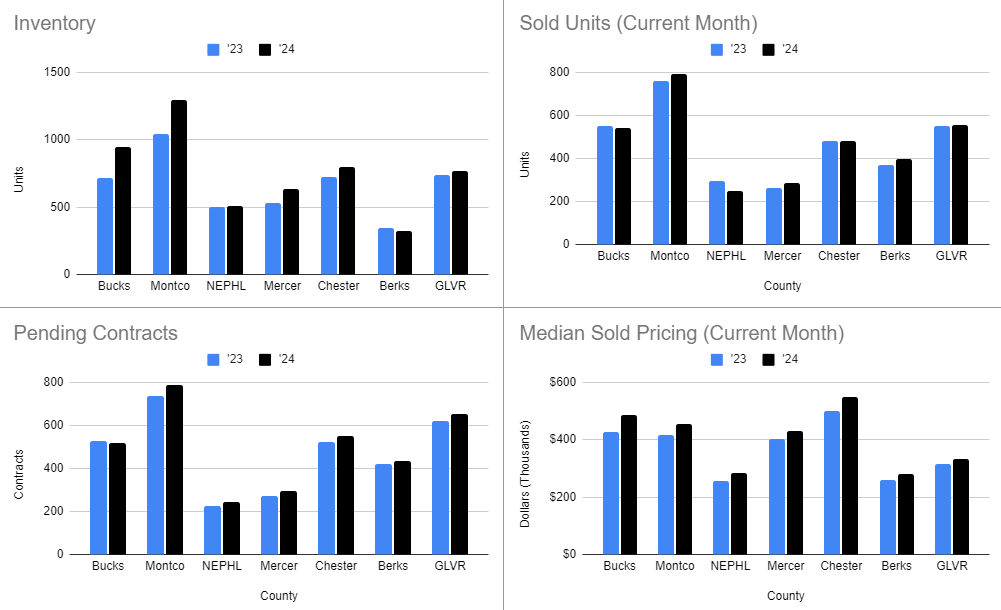
- Inventory: Inventory levels have generally increased in most areas, providing more options for buyers. The exception is Ocean County, where a significant drop in active listings was observed.
- Sold Units: Year-over-year trends showed declines in sold units across many regions, though some areas like Cape May and Montco posted monthly or annual increases.
- Median Sold Pricing: Price growth was a common theme across most markets, with the highest increase in Cape May County. Ocean County was the only exception, with a slight drop in median pricing.
- Days on Market: In most areas, homes are moving quickly, with some regions like Cape May and Mercer showing reduced DOM. Ocean and Atlantic Counties saw slight increases in selling times.
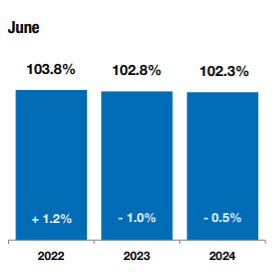
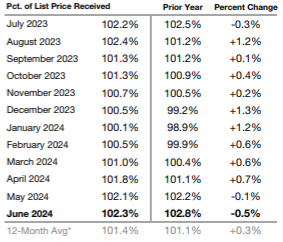
- List-to-Sold Price Ratio: While many regions reported slight declines in sold-to-list price ratios, several areas like Cape May, Atlantic County, and Mercer saw improvements, indicating continued demand.
These insights offer a comprehensive look at the real estate market across various counties in Pennsylvania and New Jersey as of August 2024, helping both buyers and sellers navigate a complex and shifting landscape.
Compare to last month’s market, HERE!
July 2024 Market Statistics
July 2024 Real Estate Market Update: Trends Across Pennsylvania and New Jersey
As we step into the second half of 2024, the real estate markets across several counties in Pennsylvania and New Jersey present a mixed bag of trends. From rising median prices to fluctuating inventory levels, here’s a detailed look at the performance across these regions for July 2024.
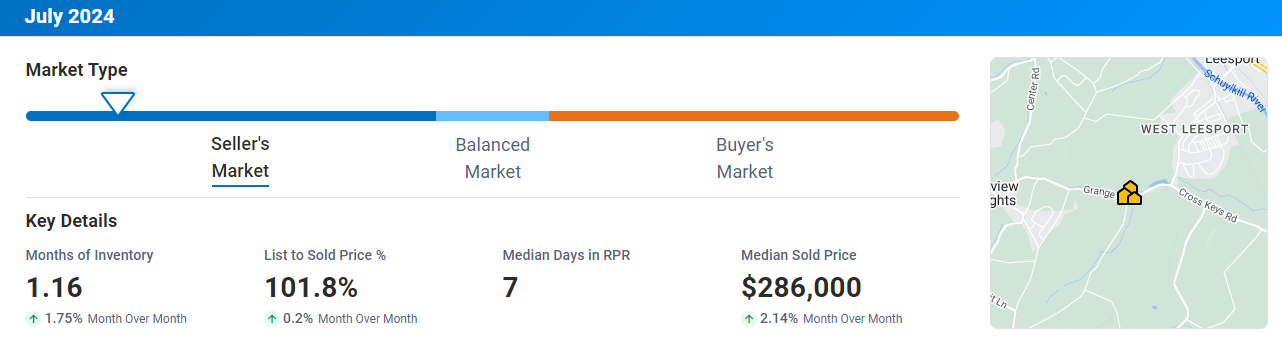
Berks County, PA
Berks County saw a modest increase in its median sold price, which climbed to $286,000, marking a 2.14% rise month-over-month (mo/mo). A total of 361 homes were sold, reflecting a 2.8% increase from the previous month. The number of active listings also grew, with 390 properties on the market, a 4% rise. Notably, homes in Berks County continue to sell quickly, with a median of just 7 days on the market. The list-to-sold price ratio is robust at 101.8%, up 0.2% mo/mo, indicating a strong seller’s market.
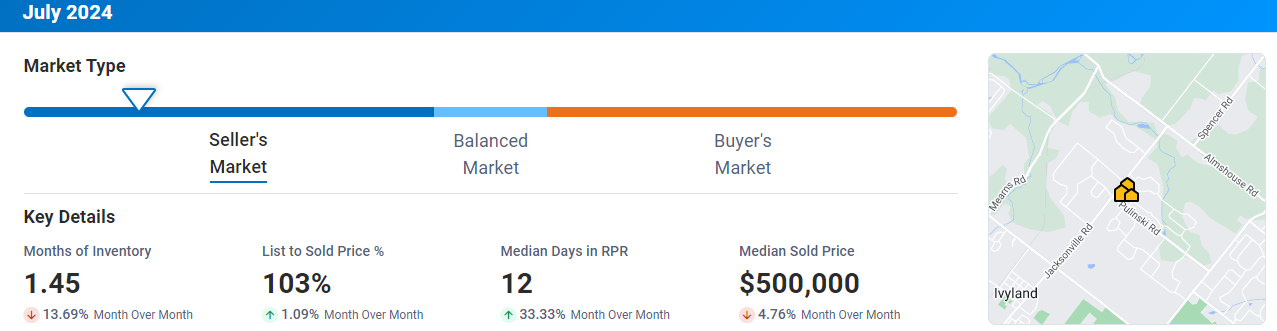
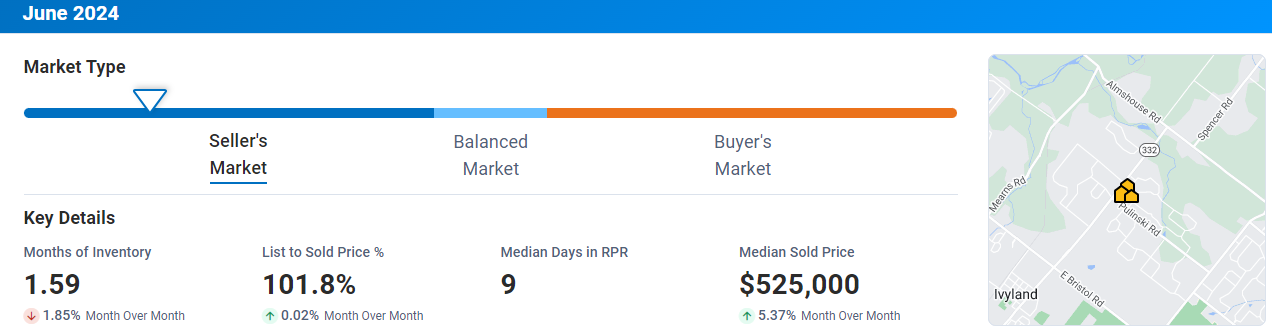
Bucks County, PA
Bucks County experienced a notable drop in its median sold price, which fell by 4.76% to $500,000. Despite this, the market remained active, with 599 homes sold—a significant 16.8% increase mo/mo. Active listings, however, declined by 12.5%, leaving 678 homes available. The median days in RPR increased to 12, a 33.33% jump. Sellers are still seeing high returns, with a list-to-sold price ratio of 103%, up 1.09% mo/mo.
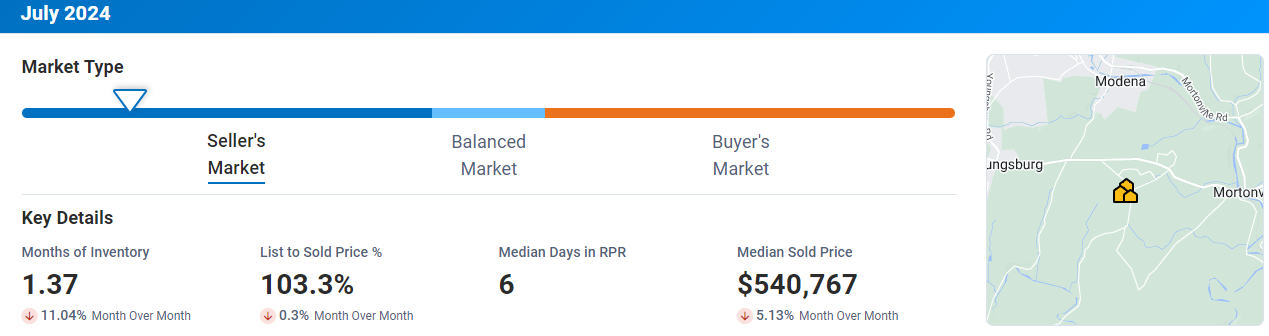
Chester County, PA
In Chester County, the market showed signs of cooling off. The median sold price decreased by 5.13% to $540,767, and the number of homes sold dropped by 10.9% to 540. Active listings fell by 9.2%, leaving 603 homes on the market. Despite these declines, homes are moving quickly, with a median of just 6 days on the market. The list-to-sold price ratio remains strong at 103.3%.
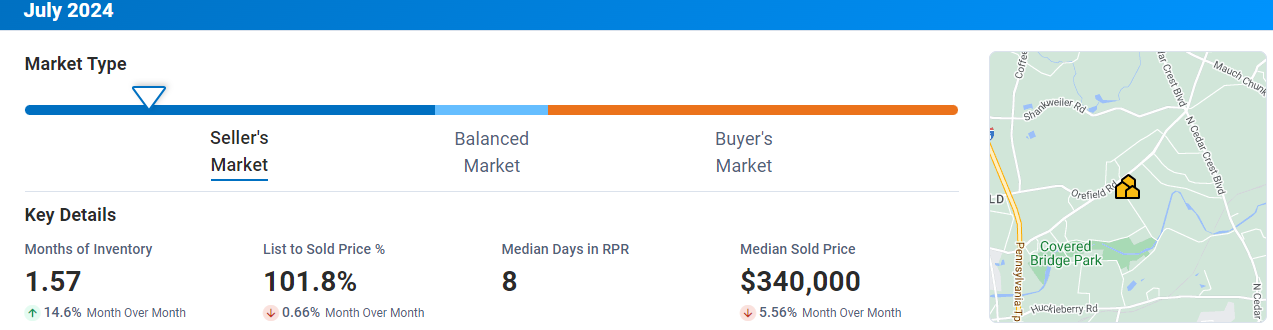
Lehigh Valley, PA
Lehigh Valley’s real estate market also saw a decline in July. The median sold price dropped by 5.56% to $340,000, with 337 homes sold, down 6.6% from the previous month. Active listings increased by 16.4%, bringing the total to 490. Homes spent a median of 8 days on the market, and the list-to-sold price ratio slightly decreased to 101.8%, down 0.66%.
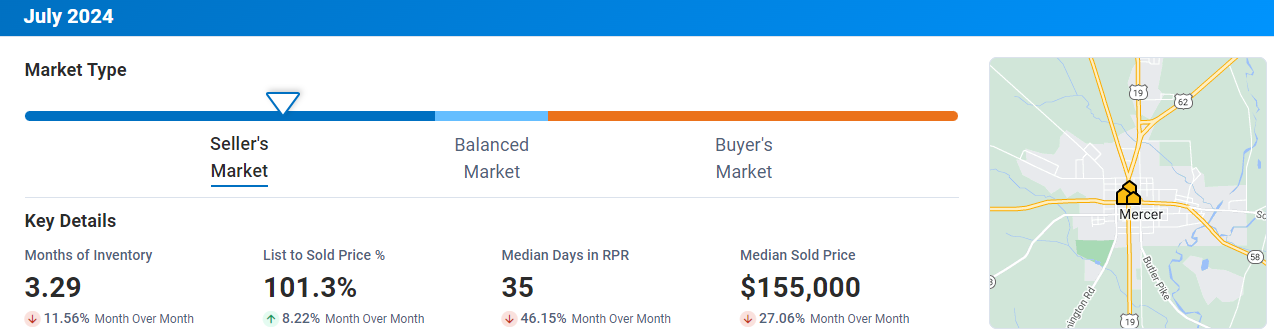
Mercer County, NJ
Mercer County faced a significant decline in its median sold price, plummeting by 27.06% to $155,000. However, the number of homes sold increased by 25% to 5. Active listings dropped by 14.8% to 23. The median days in RPR also fell sharply by 46.15%, now at 35 days. Despite the price drop, the list-to-sold price ratio surged by 8.22%, reaching 101.3%.
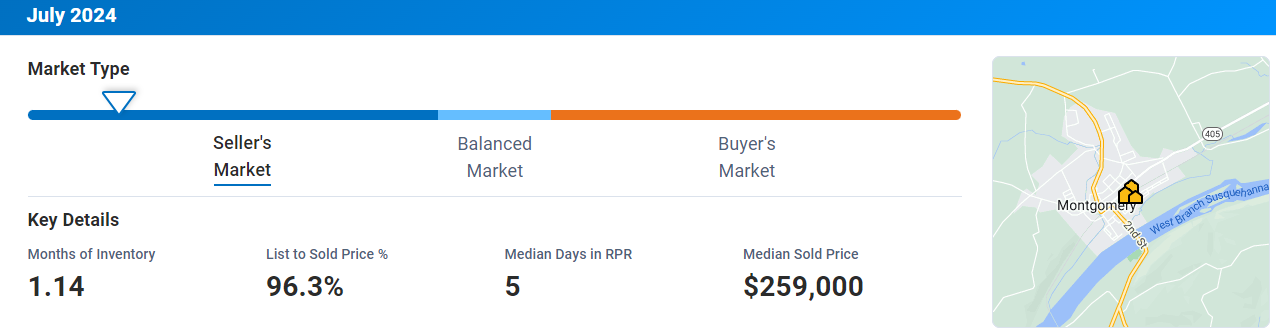
Montgomery County, PA
Montgomery County remained relatively stable, with a median sold price of $259,000. The number of homes sold jumped significantly by 150% to 5, while active listings stayed at 3. Homes sold quickly with a median of 5 days on the market, though the list-to-sold price ratio was 96.3%.
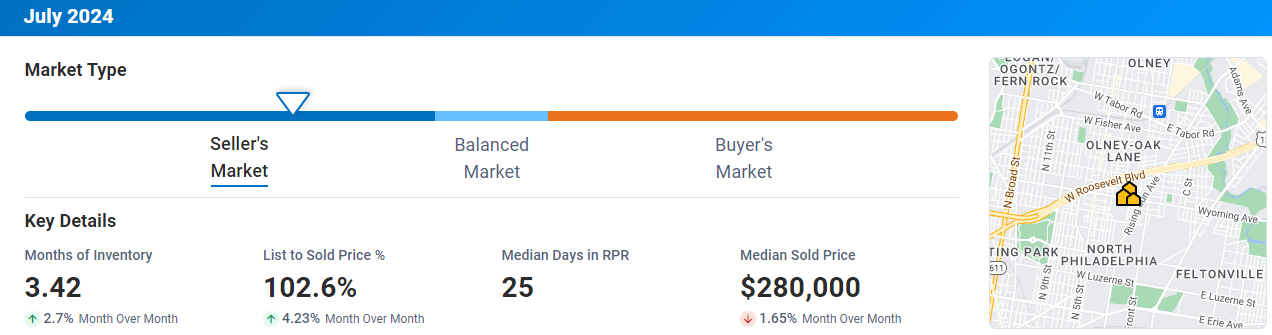
Philadelphia, PA
In Philadelphia, the median sold price slightly decreased by 1.65% to $280,000. The number of homes sold also saw a small decline of 1.5%, with 1,213 transactions. Active listings grew by 4.4% to 3,961. The median days in RPR stood at 25, and the list-to-sold price ratio increased by 4.23% to 102.6%, suggesting competitive bidding.
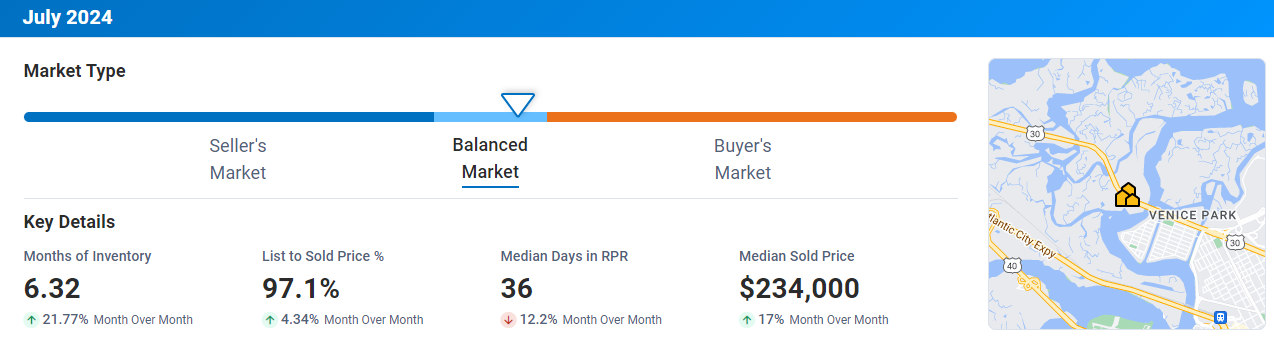
Atlantic County, NJ
Atlantic County experienced a strong increase in its median sold price, which rose by 17% to $234,000. However, the number of homes sold dropped by 40% to 21. Active listings rose by 15% to 238, while the median days in RPR decreased by 12.2% to 36 days. The list-to-sold price ratio also improved, up 4.34% to 97.1%.
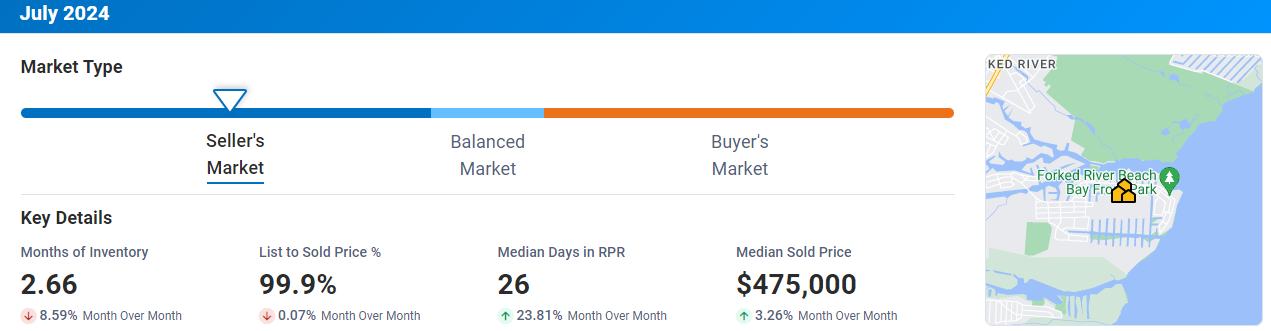
Ocean County, NJ
Ocean County’s market showed positive trends, with the median sold price increasing by 3.26% to $475,000. The number of homes sold went up by 6.5% to 847, while active listings fell by 7.2% to 2,202. The median days in RPR increased by 23.81% to 26 days. The list-to-sold price ratio slightly decreased by 0.07% to 99.9%.
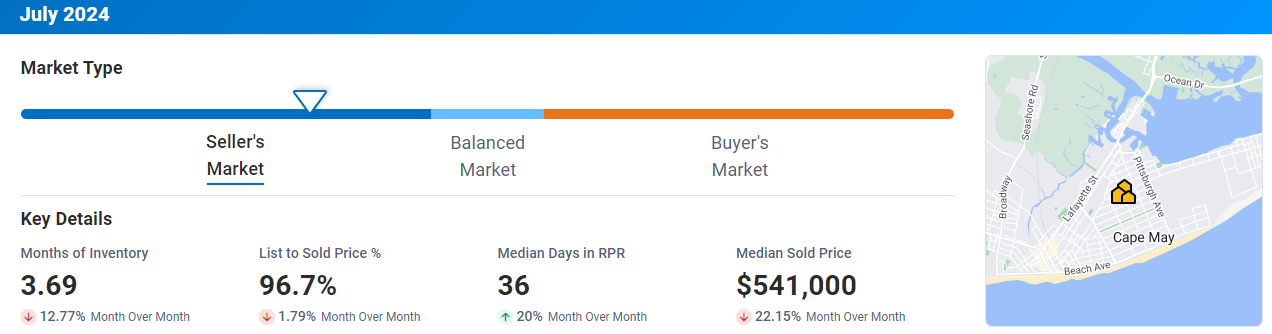
Cape May, NJ
Cape May saw a significant drop in its median sold price, which fell by 22.15% to $541,000. The number of homes sold also declined by 12.5% to 21. Active listings decreased by 8.8% to 83, and the median days in RPR increased by 20% to 36 days. The list-to-sold price ratio fell by 1.76% to 96.7%.
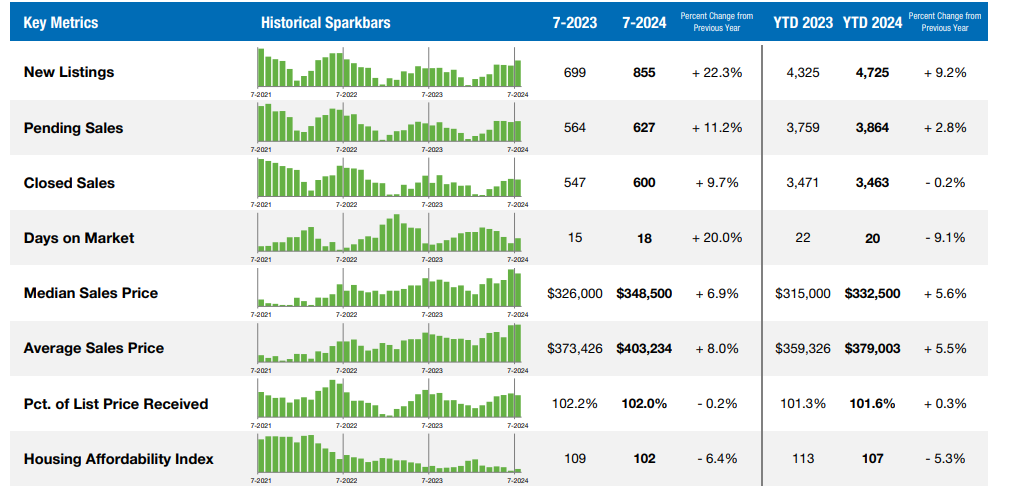
Greater Lehigh Valley REALTORS® (GLVR)
The GLVR market showed growth with a 6.9% increase in the median sold price, reaching $348,500. Homes sold went up by 9.7% to 600, and active listings surged by 19.3% to 802. The average days on the market rose by 20% to 18 days. The list-to-sold price ratio slightly decreased by 0.2% to 102%.
These figures highlight the dynamic nature of the real estate markets in Pennsylvania and New Jersey. While some areas are seeing price drops and slower sales, others continue to experience robust demand and quick turnovers. Keeping an eye on these trends will be crucial for both buyers and sellers in navigating the market as we progress through 2024.
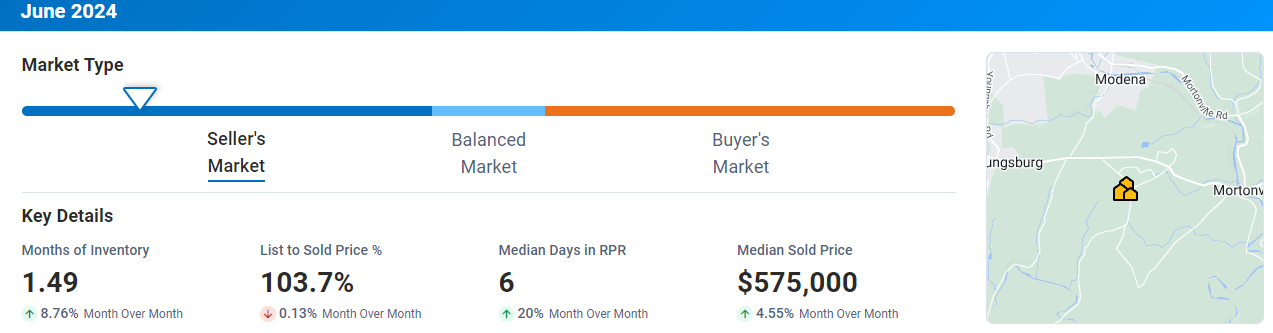
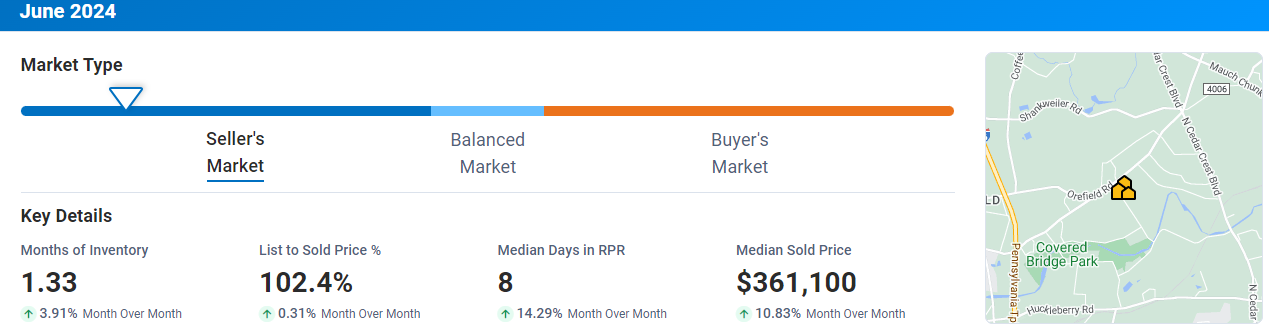
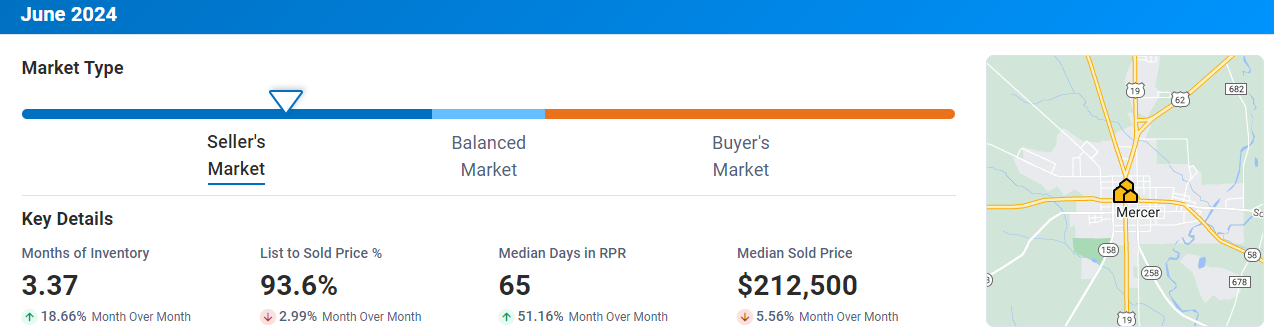
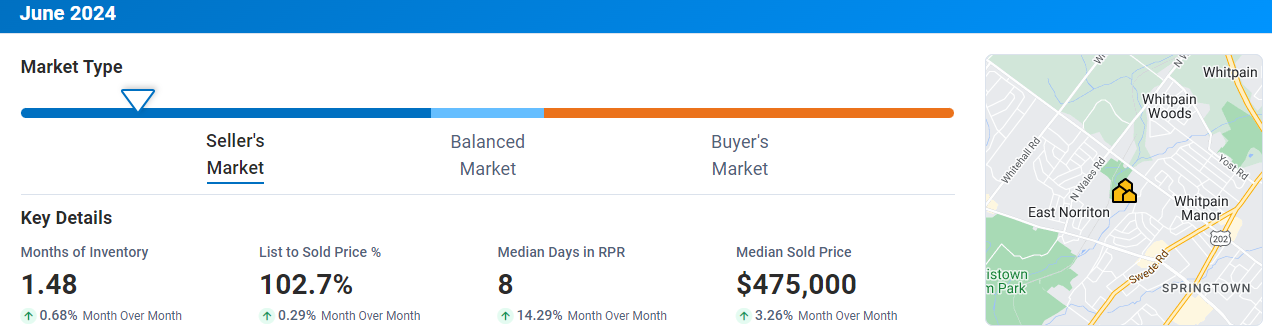
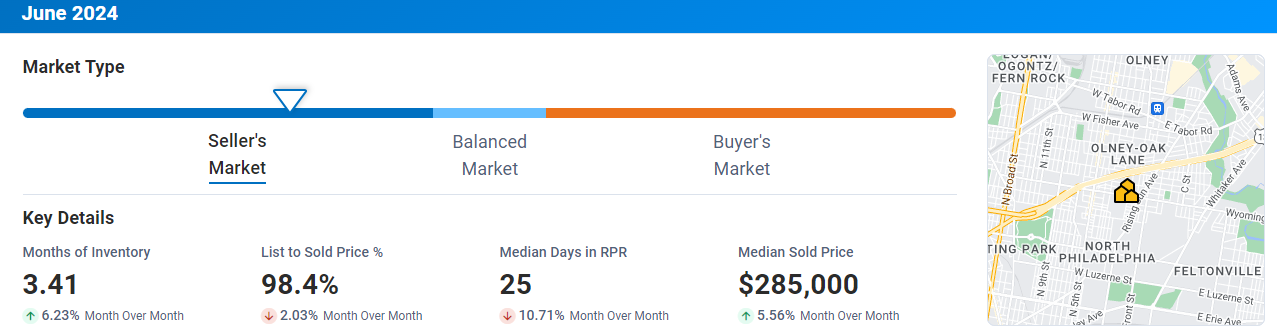
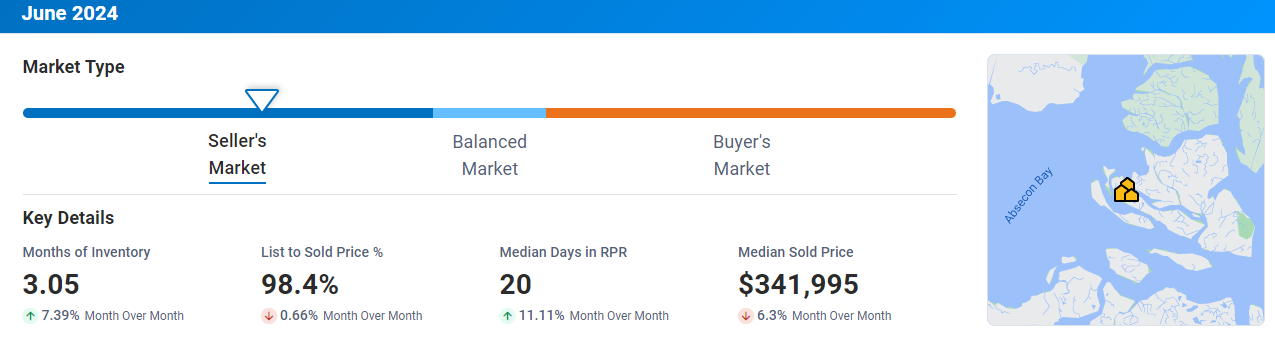
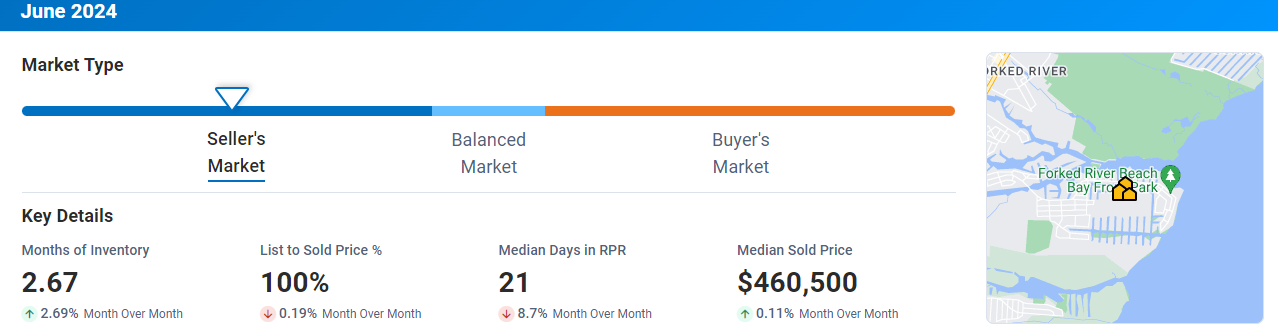
June 2024 Market Statistics
Real Estate Market Trends in Various Counties

March 2024 Market Statistics
March 2023 vs. March 2024 Real Estate Market Report
Hey there, fellow real estate enthusiasts! Today, let’s take a journey through time and explore the exciting changes that have occurred in the real estate market between March 2023 and March 2024. Buckle up, because there’s some fascinating stuff to discover!
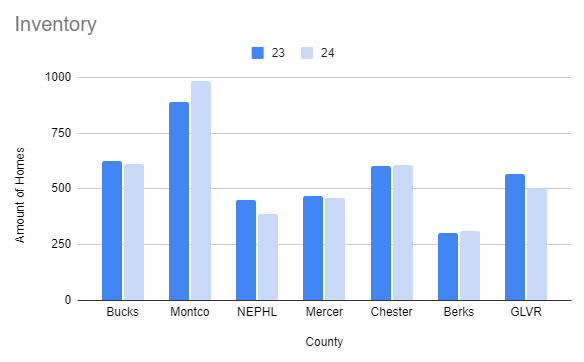
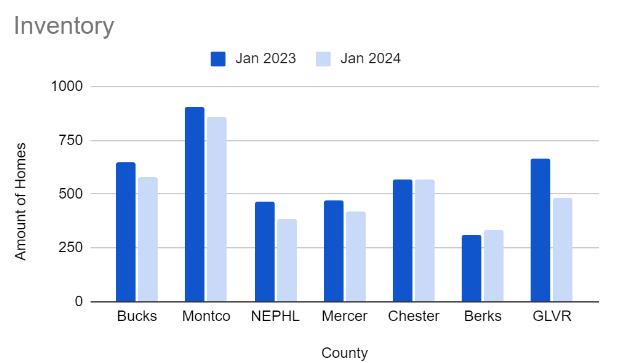
Inventory: A Mixed Picture
Let’s start by talking about inventory. In March 2024, the movement rates in tracked markets reflected a mixed inventory picture year over year. In simpler terms, some rates improved, while most worsened. Although there were improvements in some areas, the overall trend showed a decline in inventory levels across most tracked markets.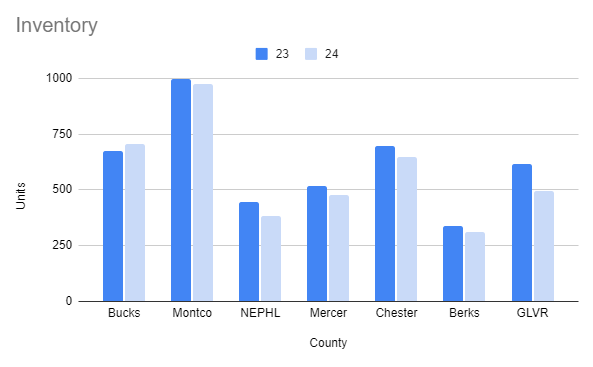
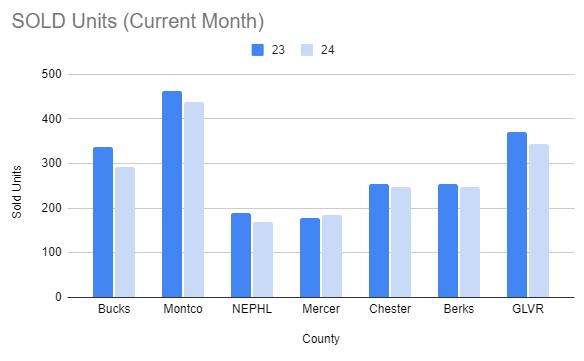
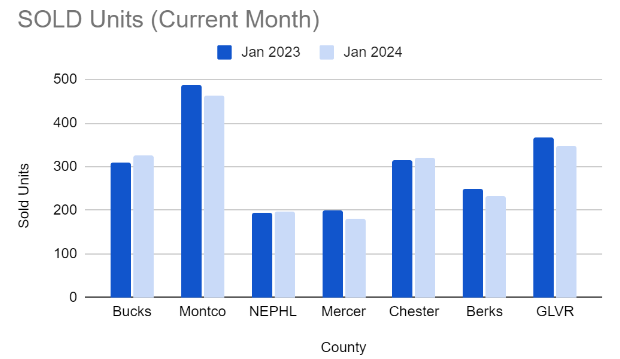
Sold Units: A Dampened Monthly Result
In March 2024, numerous markets reported dampened monthly results year over year. Rates of decline worsened in most tracked markets, indicating a slowdown in the number of homes sold compared to the previous year.
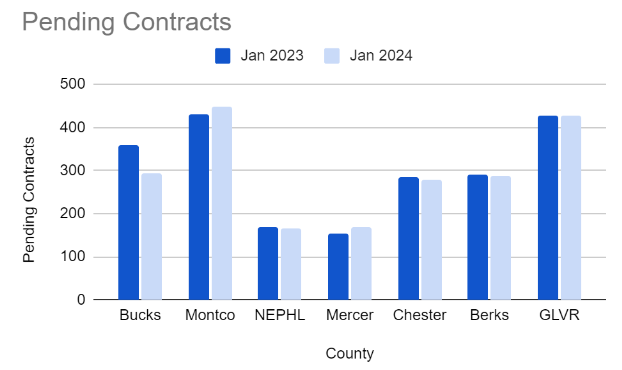
Pending Contracts: Declining Picture
Comparing March 2024 with March 2023, most markets generally reflected a declining picture in pending contracts year over year. However, Montgomery County and the Greater Lehigh Valley Region stood out as exceptions to this trend. The rates of decline varied across markets, ranging from single to double digits.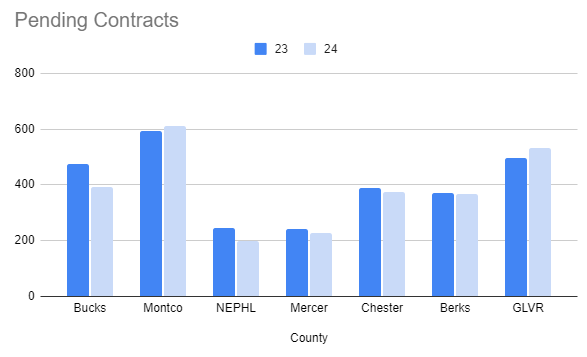
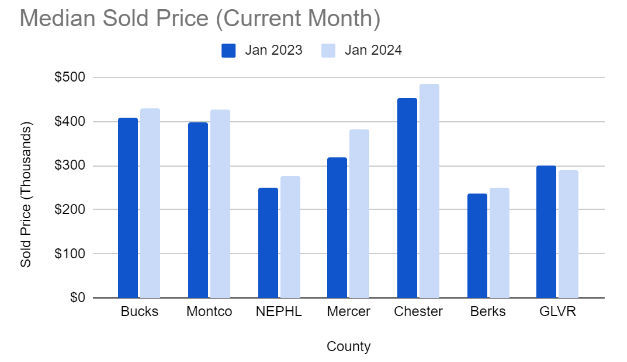
Median Sold Pricing: Upward Trend
Despite the challenges, there was good news in March 2024. Tracked markets showed an upward trend in median sold pricing, although the range varied. This indicates that home prices were on the rise, providing a positive outlook for sellers.
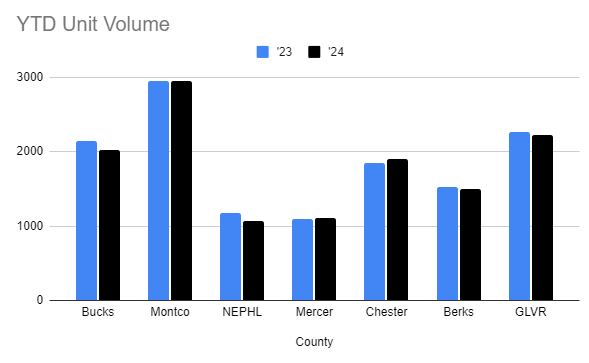
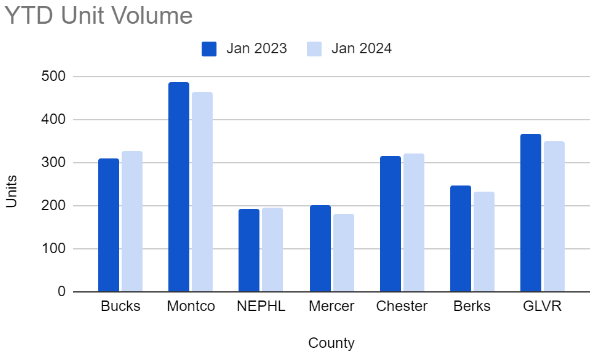
YTD Unit Volume: A Worsening Trend
Unfortunately, all markets reported dampened results in year-to-date (YTD) unit volume, with a notable worsening in the rate of decline year over year as early as 2024 progressed. This trend indicates a slowdown in the overall real estate market activity compared to the previous year.
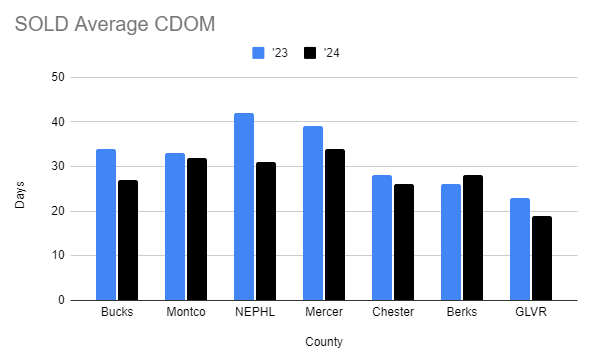
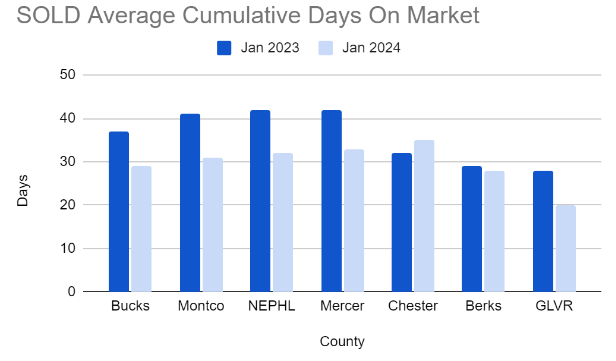
Sold Avg CDOM: Homes Selling More Quickly
One positive change observed in March 2024 was that homes were selling more quickly compared to March 2023. The average cumulative days on market (CDOM) decreased in most areas, indicating increased buyer activity and demand.
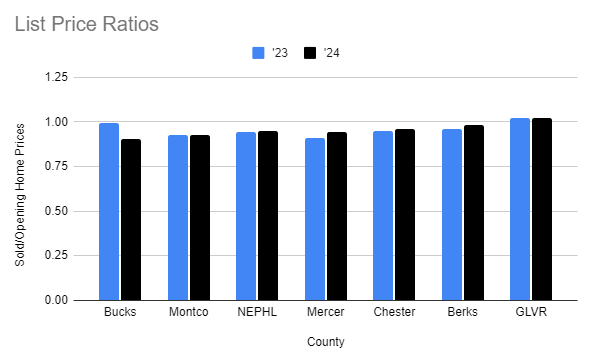
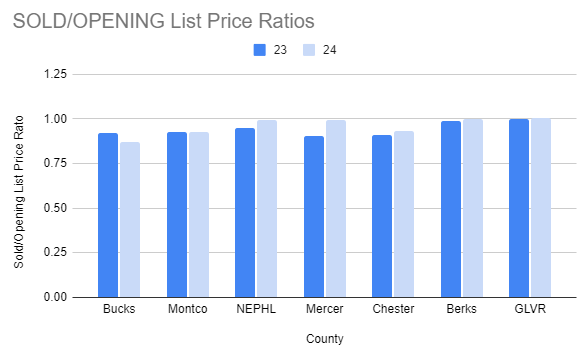
Sold/Opening List Price Ratios: Reflecting Buyer Demand
Market results in March 2024 correlated with fluctuating price increase trends and buyer demand. A few markets remained at near ~100%, comparing year over year pricing trends. This metric speaks to a generally declining seller pricing advantage in several markets.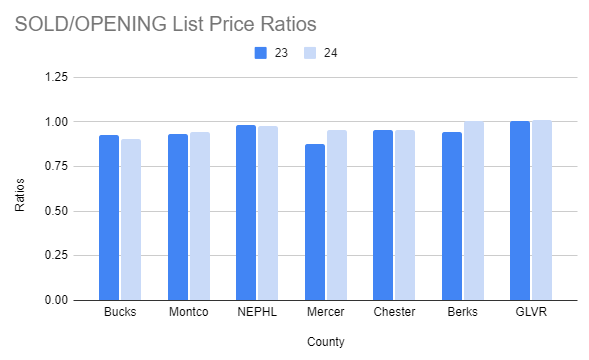
What Does This Mean for You?
Whether you’re buying or selling, it’s essential to stay informed about market trends. While the real estate market experienced some challenges in March 2024, there were also positive changes, such as the upward trend in median sold pricing and the decrease in average CDOM.
For sellers, understanding these trends can help you price your home effectively and attract potential buyers. For buyers, being aware of market dynamics can help you make informed decisions and negotiate effectively.
Final Thoughts
The real estate market is constantly evolving, and understanding these changes is key to success. By comparing March 2023 with March 2024, we can see how the market has shifted over the past year and what that means for buyers and sellers alike.
Whether you’re buying, selling, or just curious about the market, I hope this comparison has provided some valuable insights. Until next time, happy house hunting!
Take a look at last month’s market report, here: https://cbhre.com/2024/03/15/february-2024-market-statistics
Check out more from CBHearthside here: https://linktr.ee/coldwellbankerhearthside
To look at our other blogs, visit: https://cbhre.com/blog
February 2024 Market Statistics
Real Estate Market: February 2023 VS February 2024
Hey there, fellow real estate enthusiasts! Welcome back to our monthly get-together where we dissect the latest happenings in the ever-dynamic world of real estate. Today, we’re diving headfirst into February’s market report, unpacking all the juicy details and uncovering what this means for buyers, sellers, and investors alike. So, grab your favorite beverage, settle in, and let’s embark on this journey together!
Inventory Movement:
Let’s kick things off with a glimpse into the pulse of inventory movement. The good news? Market rates of movement are painting a promising picture. What does this mean exactly? Well, it boils down to this: the rates of decline have lessened, and in some cases, we’re even witnessing inventory growth. It’s like a ray of sunshine breaking through the clouds, signaling a positive shift in the real estate landscape. Take Bucks, Mercer, and Berks counties, for example – they’re leading the charge with notable improvements in this department.
Sold Units:
Now, onto sold units. While February saw numerous markets reporting dampened monthly results, there’s still reason to keep the faith. Sure, the rates of decline vary, but amidst the flux, there’s room for optimism. From Bucks to Mercer, Montco to NEPHL, each market is charting its unique course, showcasing the diverse dynamics at play.
Pending Contracts:
Ah, pending contracts – the tantalizing glimpse into future transactions. Here’s the scoop: most markets are reflecting an improving picture year over year. Whether it’s Bucks with a slight decline or Montco with a significant uptick, the overall trend is positive. It’s like watching the gears of progress slowly but surely turn towards brighter horizons.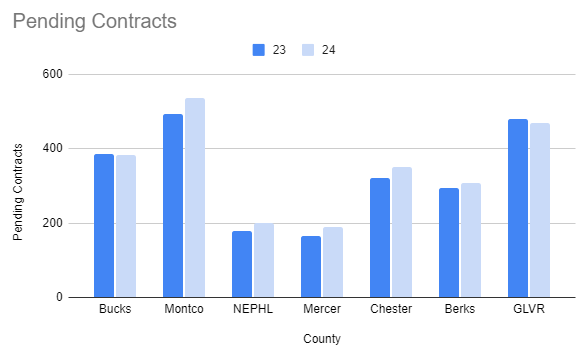
Pricing Trends:
Now, let’s talk numbers – pricing trends, to be exact. February brought with it a mixed bag of results, with most tracked markets experiencing moderate price increases. From Bucks to Mercer, NEPHL to Chester, each market is carving out its unique path in response to supply and demand dynamics.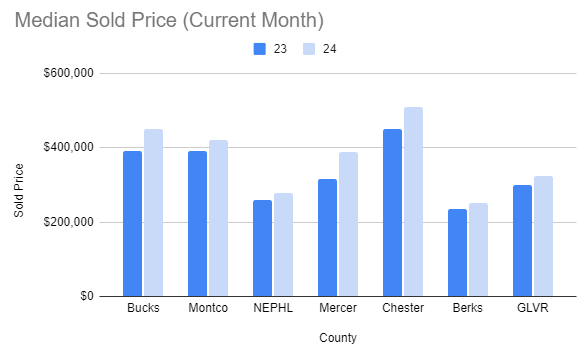
Year-to-Date Unit Volume:
As we delve deeper into the year-to-date unit volume, we’re met with a mixed bag of results. While most markets are reporting dampened figures, there’s a notable improvement in the rate of decline year over year. It’s like witnessing a phoenix rise from the ashes – a testament to the resilience of the real estate market.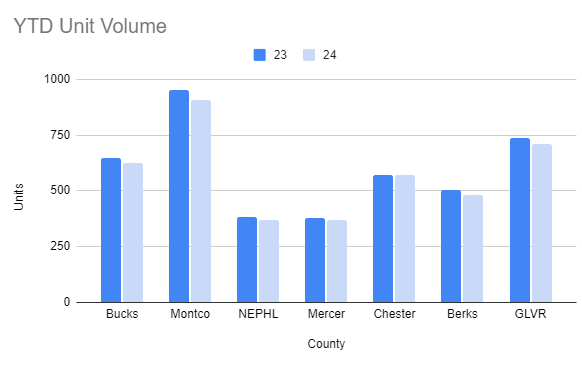
Sold Days on Market:
Homes are flying off the shelves at a faster pace in most markets, indicating decreased selling time year over year. This marks a significant shift from what we observed throughout 2023, highlighting the evolving nature of buyer behavior and market dynamics.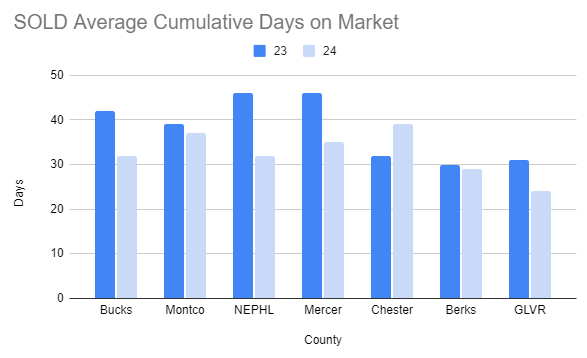
Sold/Opening List Price Ratios:
Last but not least, let’s discuss sold/opening list price ratios. This metric provides insights into the fluctuating price increase trend and buyer demand. From Bucks to GLVR, each market’s results correlate with its unique pricing dynamics, signaling a shift in seller pricing advantage.
In conclusion, February’s market report paints a nuanced picture of the real estate landscape. While challenges remain, there’s a sense of cautious optimism in the air. From improving inventory movement to resilient pricing trends, each data point offers valuable insights for navigating today’s market with confidence. So, here’s to staying informed, staying adaptable, and seizing those opportunities as they arise. Until next time, happy house hunting (or selling)!
Take a look at last month’s market report, here: https://cbhre.com/2024/02/20/january-2024-market-statistics
Check out more from CBHearthside here: https://linktr.ee/coldwellbankerhearthside
To look at our other blogs, visit: https://cbhre.com/blog
January 2024 Market Statistics
Real Estate Market: January 2023 VS January 2024
Hey there, folks! Let’s take a stroll through the real estate market and compare how January 2023 stacks up against January 2024. Buckle up, because we’re diving into the nitty-gritty of inventory movement, sold units, pending contracts, pricing trends, and more!
Market Inventory Movement:
So, first up on our radar is inventory movement. It seems like across the board, we’re seeing a bit of a dip in inventory movement compared to last year, except for Berks and Chester counties, where things are holding steady. This could mean a tougher hunt for that dream property, but hey, there’s always a silver lining – some regions are showing signs of resilience, so hang in there!
Sold Units:
Now, let’s talk sold units. While some markets are reporting a bit of a slowdown, Bucks, Northeast Philadelphia (NEPHL), and Chester are the stars of the show with positive unit sales. It’s like they’ve got their own little real estate party going on! And hey, overall, it looks like the sales activity is starting to stabilize in a good chunk of the markets. Progress, people!
Pending Contracts:
Ah, pending contracts – the mysterious middle ground between “yes” and “not quite yet.” It’s a mixed bag out there, with changes ranging from single to double digits. It just goes to show that the real estate market dances to its own beat, influenced by all sorts of factors. Keep your eyes peeled for those twists and turns!
Pricing Trends in the Market:
Now, onto pricing trends. Most markets are seeing modest price bumps, but the Greater Lehigh Valley (GLVR) is keeping it chill with relatively flat pricing trends. Every market’s got its own rhythm, right? It’s like a symphony of supply and demand, playing out differently in each area. So, whether you’re buying or selling, knowing these trends can be your secret weapon.
Year-To-Date Unit Volume:
YTD unit volume – sounds fancy, doesn’t it? It’s basically the story of how many properties have changed hands over time. Tracking this gives us a big-picture view of market activity, helping us spot trends and shifts. It’s like connecting the dots to see the bigger picture – pretty cool, huh?
Sold Days on Market:
Sold DOM (Days on Market) – the countdown clock for sellers. Looks like homes are flying off the shelves faster in most markets, except for Chester County, where things are taking a tad longer. It’s like a game of musical chairs out there – you snooze, you lose!
Check out more from CBHearthside here: https://linktr.ee/coldwellbankerhearthside
To look at our other blogs, visit: https://cbhre.com/blog


")
