
 Facebook
 X
X
 Pinterest
 Copy Link
March 2023 vs. March 2024 Real Estate Market Report
Hey there, fellow real estate enthusiasts! Today, let’s take a journey through time and explore the exciting changes that have occurred in the real estate market between March 2023 and March 2024. Buckle up, because there’s some fascinating stuff to discover!
Inventory: A Mixed Picture
Let’s start by talking about inventory. In March 2024, the movement rates in tracked markets reflected a mixed inventory picture year over year. In simpler terms, some rates improved, while most worsened. Although there were improvements in some areas, the overall trend showed a decline in inventory levels across most tracked markets.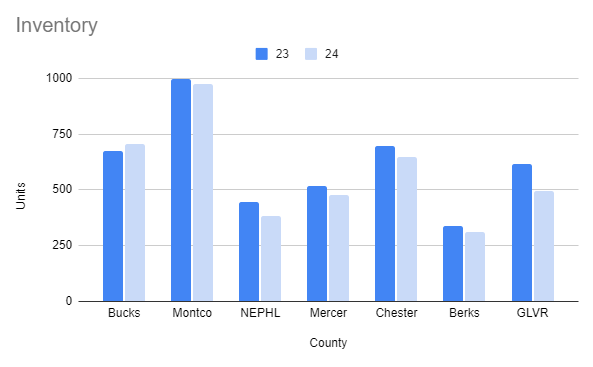
Sold Units: A Dampened Monthly Result
In March 2024, numerous markets reported dampened monthly results year over year. Rates of decline worsened in most tracked markets, indicating a slowdown in the number of homes sold compared to the previous year.
Pending Contracts: Declining Picture
Comparing March 2024 with March 2023, most markets generally reflected a declining picture in pending contracts year over year. However, Montgomery County and the Greater Lehigh Valley Region stood out as exceptions to this trend. The rates of decline varied across markets, ranging from single to double digits.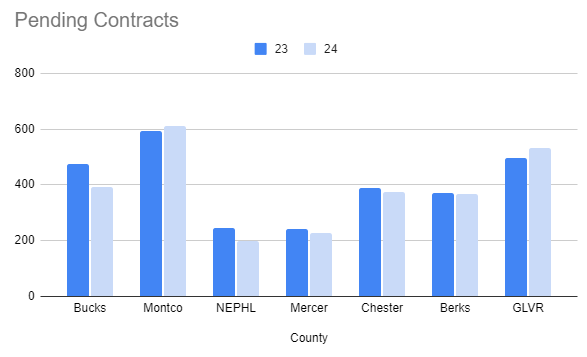
Median Sold Pricing: Upward Trend
Despite the challenges, there was good news in March 2024. Tracked markets showed an upward trend in median sold pricing, although the range varied. This indicates that home prices were on the rise, providing a positive outlook for sellers.
YTD Unit Volume: A Worsening Trend
Unfortunately, all markets reported dampened results in year-to-date (YTD) unit volume, with a notable worsening in the rate of decline year over year as early as 2024 progressed. This trend indicates a slowdown in the overall real estate market activity compared to the previous year.
Sold Avg CDOM: Homes Selling More Quickly
One positive change observed in March 2024 was that homes were selling more quickly compared to March 2023. The average cumulative days on market (CDOM) decreased in most areas, indicating increased buyer activity and demand.
Sold/Opening List Price Ratios: Reflecting Buyer Demand
Market results in March 2024 correlated with fluctuating price increase trends and buyer demand. A few markets remained at near ~100%, comparing year over year pricing trends. This metric speaks to a generally declining seller pricing advantage in several markets.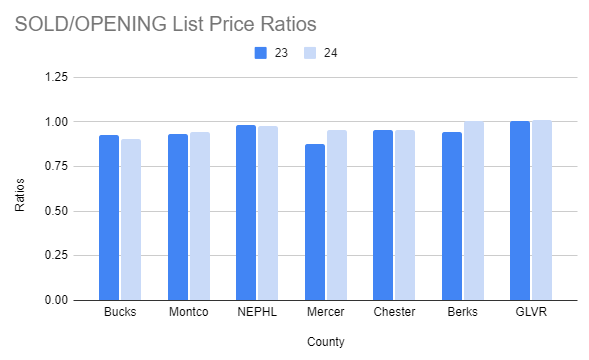
What Does This Mean for You?
Whether you’re buying or selling, it’s essential to stay informed about market trends. While the real estate market experienced some challenges in March 2024, there were also positive changes, such as the upward trend in median sold pricing and the decrease in average CDOM.
For sellers, understanding these trends can help you price your home effectively and attract potential buyers. For buyers, being aware of market dynamics can help you make informed decisions and negotiate effectively.
Final Thoughts
The real estate market is constantly evolving, and understanding these changes is key to success. By comparing March 2023 with March 2024, we can see how the market has shifted over the past year and what that means for buyers and sellers alike.
Whether you’re buying, selling, or just curious about the market, I hope this comparison has provided some valuable insights. Until next time, happy house hunting!
Take a look at last month’s market report, here: https://cbhre.com/2024/03/15/february-2024-market-statistics
Check out more from CBHearthside here: https://linktr.ee/coldwellbankerhearthside
To look at our other blogs, visit: https://cbhre.com/blog


