
 Facebook
 X
X
 Pinterest
 Copy Link
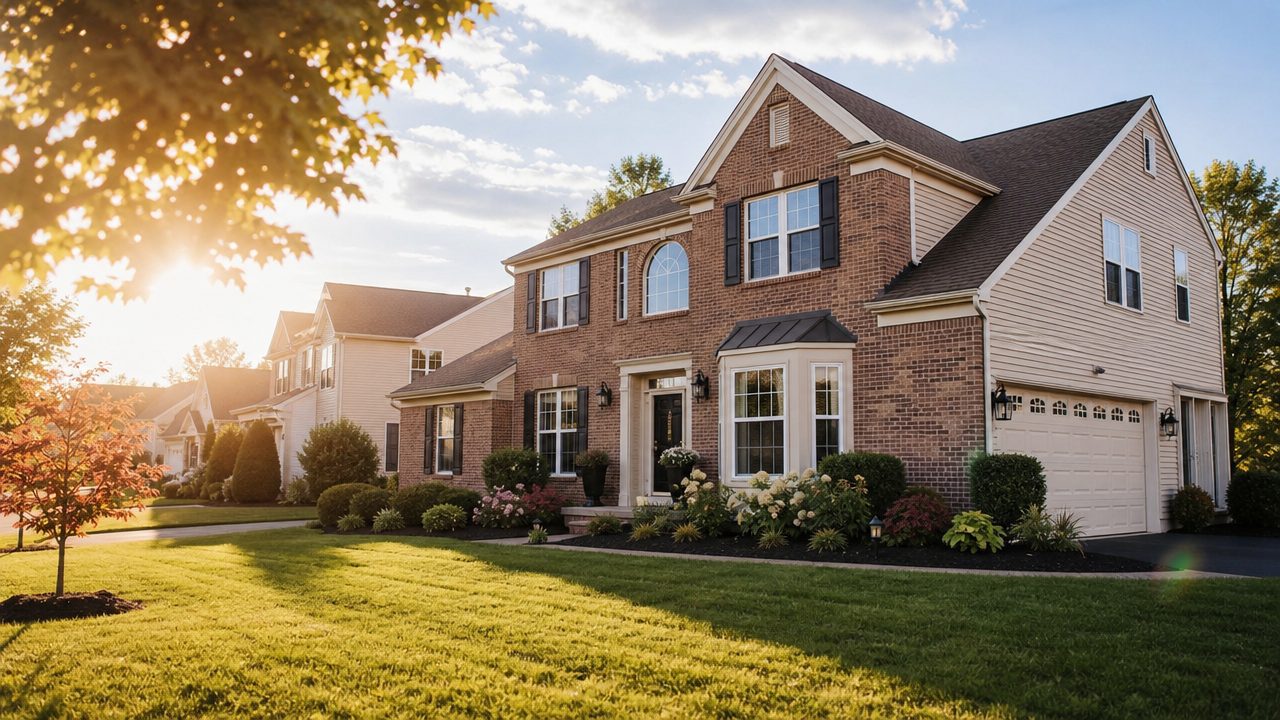
A look at how the Greater Philadelphia and Lehigh Valley markets performed last month — brought to you by Coldwell Banker Hearthside.
Coldwell Banker Hearthside proudly serves buyers and sellers across Berks, Bucks, Chester, Montgomery, and Philadelphia Counties in Pennsylvania; Hunterdon, Mercer, and Somerset Counties in New Jersey; the Greater Lehigh Valley (Lehigh and Northampton Counties); and the Pocono Mountains region. Whether you’re weighing a move, thinking about listing your home, or just want to know what’s happening in your neighborhood, our agents track this data every month so we can give you the most current advice. Here’s what July and August 2026 looked like across our footprint.
The Big Picture
Sales activity was up year-over-year in most of our markets, prices continued to climb almost everywhere, and inventory kept building — a trend that’s giving buyers a bit more breathing room than they’ve had in recent years, even as competition for well-priced homes remains real. Days on market stayed remarkably tight across the Pennsylvania suburbs, typically under a week, while New Jersey and Philadelphia markets moved a bit slower.
| County | Closed Sales (Jul ’26) | YoY Change | Median Sold Price | YoY Change | Median DOM | Active Listings | Months Supply |
|---|---|---|---|---|---|---|---|
| Berks, PA | 415 | +10.1% | $323,748 | +4.4% | 7 days | 516 | 1.45 |
| Bucks, PA | 663 | +7.5% | $546,665 | +6.1% | 7 days | 1,048 | 1.98 |
| Chester, PA | 615 | +2.8% | $595,000 | +2.6% | 6 days | 916 | 1.91 |
| Montgomery, PA | 904 | +1.1% | $510,000 | +2.0% | 7 days | 1,299 | 1.81 |
| Philadelphia, PA | 1,250 | +5.0% | $292,000 | +4.3% | 24 days | 4,926 | 4.35 |
| Hunterdon, NJ | 32 | +113.3% | $847,500 | +66.2% | 19 days | 60 | 3.53 |
| Mercer, NJ | 344 | -0.6% | $565,000 | +6.6% | 17 days | 783 | 3.02 |
| Somerset, NJ | 31 | -18.4% | $865,000 | -5.5% | 15 days | 80 | 4.00 |
| Lehigh Valley (Lehigh & Northampton) | 636 | -0.8% | $389,500 | +3.9% | 17 days | 870* | 1.6 |
Lehigh Valley figure reflects total inventory of homes available, per Greater Lehigh Valley REALTORS®.
Pennsylvania Suburbs: Fast-Moving and Still Competitive
Berks County had a strong month, with closed sales up 10.1% year-over-year to 415 and the median sold price climbing to $323,748. Active listings jumped 20% compared to last July, giving buyers more to choose from, though homes are still selling in about a week.
Bucks County closed sales rose 7.5% to 663, and the median price reached $546,665, up 6.1% from a year ago. New listings were up over 12%, and active inventory grew nearly 18% — a market that’s staying busy on both sides of the transaction.
Chester County remains one of the region’s priciest markets, with a median sold price of $595,000. Closed sales ticked up 2.8% year-over-year, and homes continue to move quickly, typically in six days.
Montgomery County saw 904 closed sales in July, essentially flat with a slight 1.1% gain over last year, while the median price rose to $510,000. Active listings were up 13.3%, a sign that more sellers are testing the market.
Philadelphia County posted 1,250 closed sales, up 5.0% year-over-year, with the median sold price reaching $292,000 — still the most affordable entry point in our coverage area. Days on market and months of supply are notably higher here than in the surrounding suburbs, giving buyers more negotiating room.
New Jersey Counties: Prices Climbing, Inventory Still Tight
Hunterdon County stood out this month, with closed sales more than doubling (+113.3%) year-over-year and the median sold price surging 66.2% to $847,500. This is a smaller, lower-volume market, so a handful of higher-priced sales can move the numbers significantly, but it’s a clear signal of strong buyer interest in the county’s higher-end inventory.
Mercer County closed sales were essentially flat (-0.6%) at 344, but the median sold price rose 6.6% to $565,000. Active listings grew 26.7% year-over-year, giving buyers noticeably more options than last summer.
Somerset County saw closed sales pull back 18.4% and the median price dip 5.5% to $865,000 — still the highest median price in our footprint. Active listings, however, jumped 66.7%, suggesting more sellers are entering an already thin market.
Greater Lehigh Valley: Prices at a Record Pace
Across Lehigh and Northampton Counties, closed sales held nearly steady at 636 (-0.8% year-over-year), while the median sales price climbed to $389,500, up 3.9% and continuing a long streak of annual price gains. New listings (832) and pending sales (642) were both up compared to last July, and homes are receiving 101.4% of list price on average — a sign sellers are still holding the advantage in well-priced listings. Inventory eased slightly (-4.8%), keeping months of supply at a tight 1.6.
Pocono Mountains: A Market Shifting Toward Buyers
The Poconos are telling a different story than the rest of our footprint this year — and it’s one worth watching closely if you’re buying or selling a mountain or lake-area home.
- Inventory is building fast. Active listings reached 2,369 as of August 2026, pushing months of supply to 7.0 — up sharply from around 4.8 months back in 2023. That’s a meaningfully more balanced, even buyer-leaning, market compared to the ultra-tight suburbs closer to Philadelphia.
- Prices are still climbing. The median price of new listings hit $329,000 in August 2026, more than 10% above the full-year 2025 median, and the annual closed median price now stands at $305,000. Price per square foot has followed suit, rising to $204/sqft for new listings in 2026 (up from $182 in 2023) and $188/sqft for sold properties.
- Homes are taking longer to sell. Average days on market has ranged from 51 to 83 days in recent months, well above prior years, though it eased back to about 51 days this summer.
- Sellers are still getting close to asking. List-to-sale price ratios are holding at roughly 96–97%, a bit softer than the 2021–22 peak but strong for a market with growing supply.
- Transaction volume has cooled. Closed sales are down significantly year-to-date — 2,884 closings annually in 2026 versus 4,756 in 2025 — and new listings are also down (5,113 YTD 2026 vs. 7,483 for all of 2025), even as active inventory keeps accumulating.
- New listings volume (Courted.io data) echoes this cooling trend: August 2026 month-to-date new listing dollar volume was $209M, down 17% from July’s $251M, and the last 12 months’ volume of $2.48B is down 1% from the prior 12-month period.
What it means: rising inventory and longer days on market give Pocono buyers real leverage and more homes to choose from — but sellers who price sharply and market well are still finding buyers, and price growth remains solid. If you’re weighing a second-home purchase, an investment property, or a move to the mountains, this is a market where preparation and pricing strategy matter more than ever.
What This Means for You
Across nearly all of our markets, homes are still selling quickly and prices are still rising — but rising inventory in several counties means buyers finally have a bit more to choose from than they did a year ago. If you’ve been on the fence about listing, growing buyer demand paired with still-limited supply could work in your favor. If you’re house hunting, more active listings mean more opportunities, but well-priced homes are still moving fast in most of our Pennsylvania markets.
Whatever your goals, the agents at Coldwell Banker Hearthside know these neighborhoods block by block. Reach out to your local Hearthside office today, and let’s talk about what this market means for you.
Data sourced from Bright MLS Research (Berks, Bucks, Chester, Hunterdon, Mercer, Montgomery, Philadelphia, and Somerset Counties, data as of August 6, 2026), Greater Lehigh Valley REALTORS® Monthly Indicators (Lehigh and Northampton Counties, data as of August 10, 2026), Pocono Mountains AoR Market Highlights (as of August 2026), and Courted.io new listing volume data for the Pocono Mountains AoR.
